Navigating the Graphics Pipeline
CS 184: Computer Graphics and Imaging, Spring 2017
Oliver O'Donnell, CS184-agh
Project 1: Rasterizer
Overview
Graphics concepts are fascinating! The project brought together many different math concepts (mostly linear algebra) to answer questions like "how do you map a texture to a surface?" and "how do video games efficiently render textures that are far away?". For this project, I dipped my toe into a very large (and at times, confusing) codebase and was able to fill in skeleton code to do very cool things. It gives me real appreciation for those who developed the first graphics engines without prior code.
Section I: Rasterization
Part 1: Rasterizing single-color triangles
A triangle is defined by 3 points in the x-y plane and by the color(s) inside it. Given a triangle defined in that way, my task was to go through and draw those colors onto the appropriate pixels in the samplebuffer. Note: The samplebuffer is a 2-d array containing the color values for each pixel or sub-pixel on the canvas.
Iterating through all x-y values and then checking whether those values fell inside the triangle would have worked, but would have been inefficient. Therefore I only iterated through the subset of x-y values inside the triangle's bounding box. (shown below, figure from Sunshine2k.com)
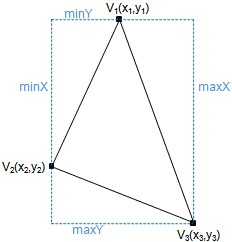
I used the edge vectors of the triangle to test whether an (x, y) point was inside or outside of it.
We can find out whether a point is to the left or right of, or exactly on one of the sides of the triangle by projecting it onto the norm of that side. We do this for each edge, and if the sign matches for all three, then the point is inside the triangle.

Finally, if the point (x,y) is inside the triangle we place the relevant color into samplebuffer[x][y] using the method fillColor().
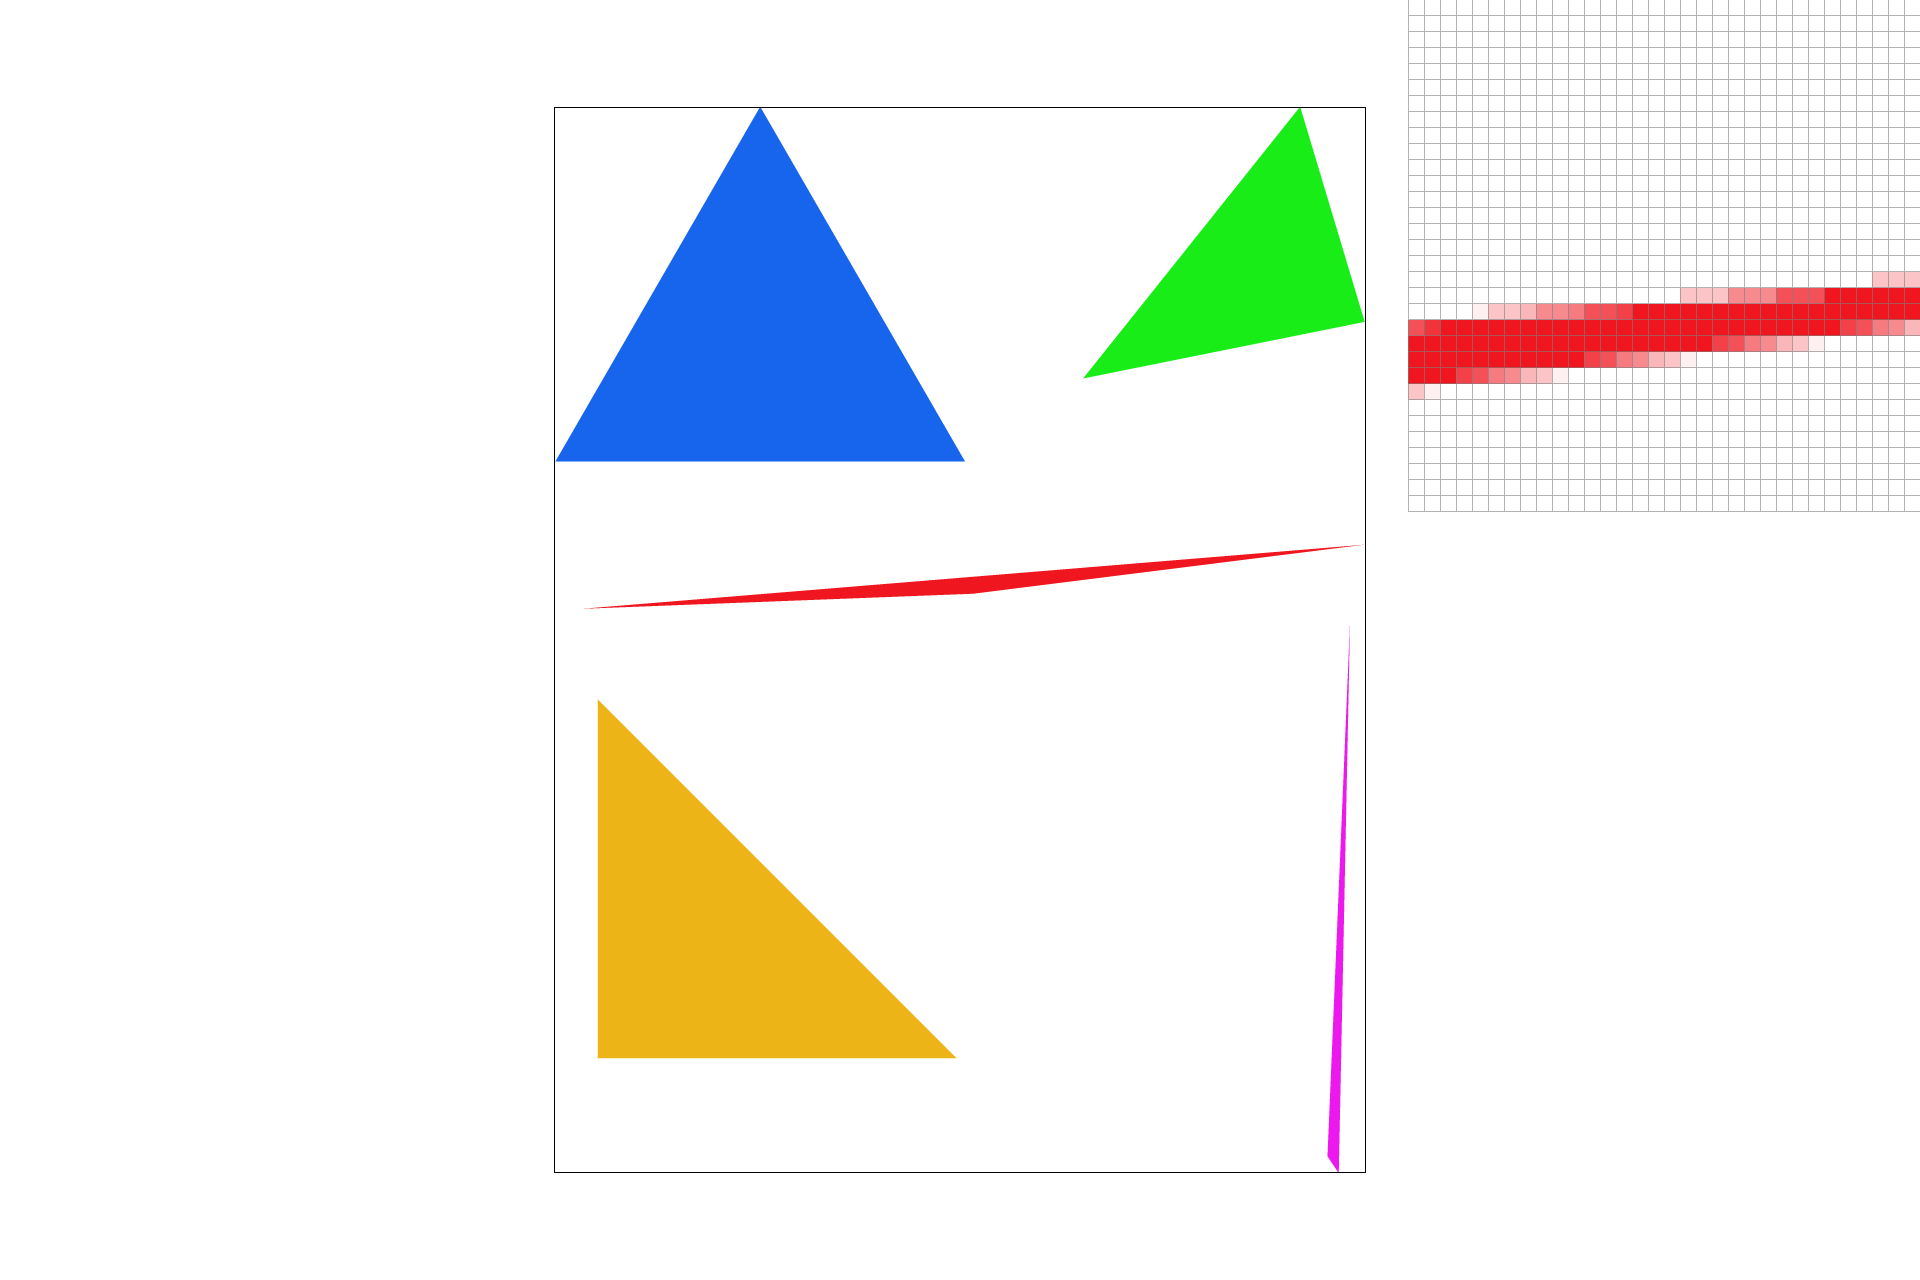
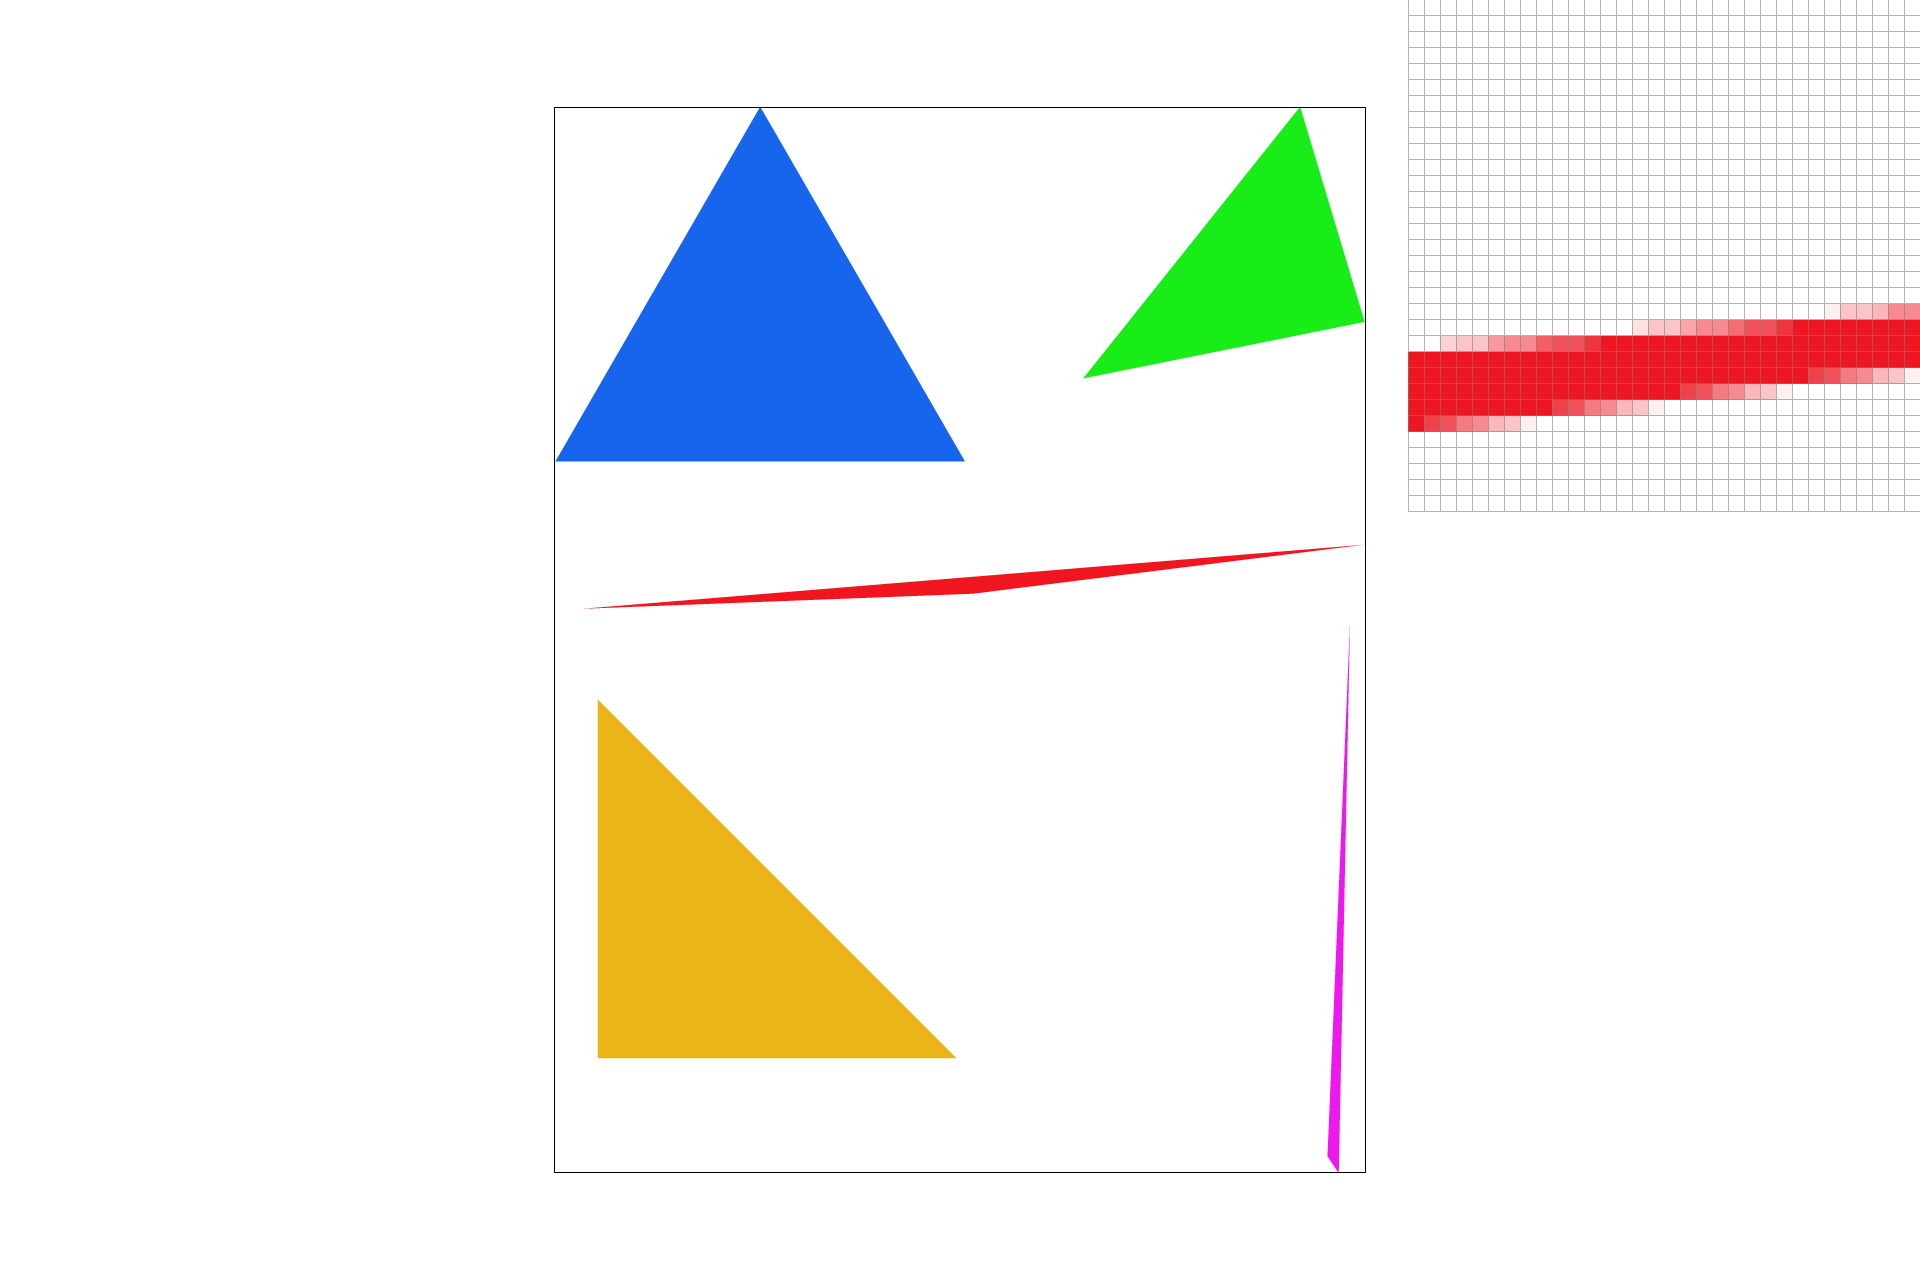
Here is a png screenshot of basic/test4.svg with the default viewing parameters and with the pixel inspector centered on an interesting part of the scene.
Part 2: Antialiasing triangles
I implemented supersampling by further subdividing my for-loop from part 1.
I modified the rasterization pipeline in two places:
- In the previous step, everything I was doing (triangle test and retrieving the color), was being applied to the center of the (x,y) pixel. Now those actions had to be applied to the
sample_ratesub-pixels inside (x,y). The only change for this step was to iterate through sub-pixels for every (x,y) location. I achieved this by nesting another for-loop inside the for-loop that iterates through every (x,y) pair. - I also had to modify the way that
SampleBuffer::get_pixel_colorretrieved colors. It now had to take the average the color of all sub-pixels (but not the alpha, as I learned the hard way!).
I used supersampling to antialias my triangles by taking the average of 4, 9, 16, or more samples rather than just the center of the screen pixel.
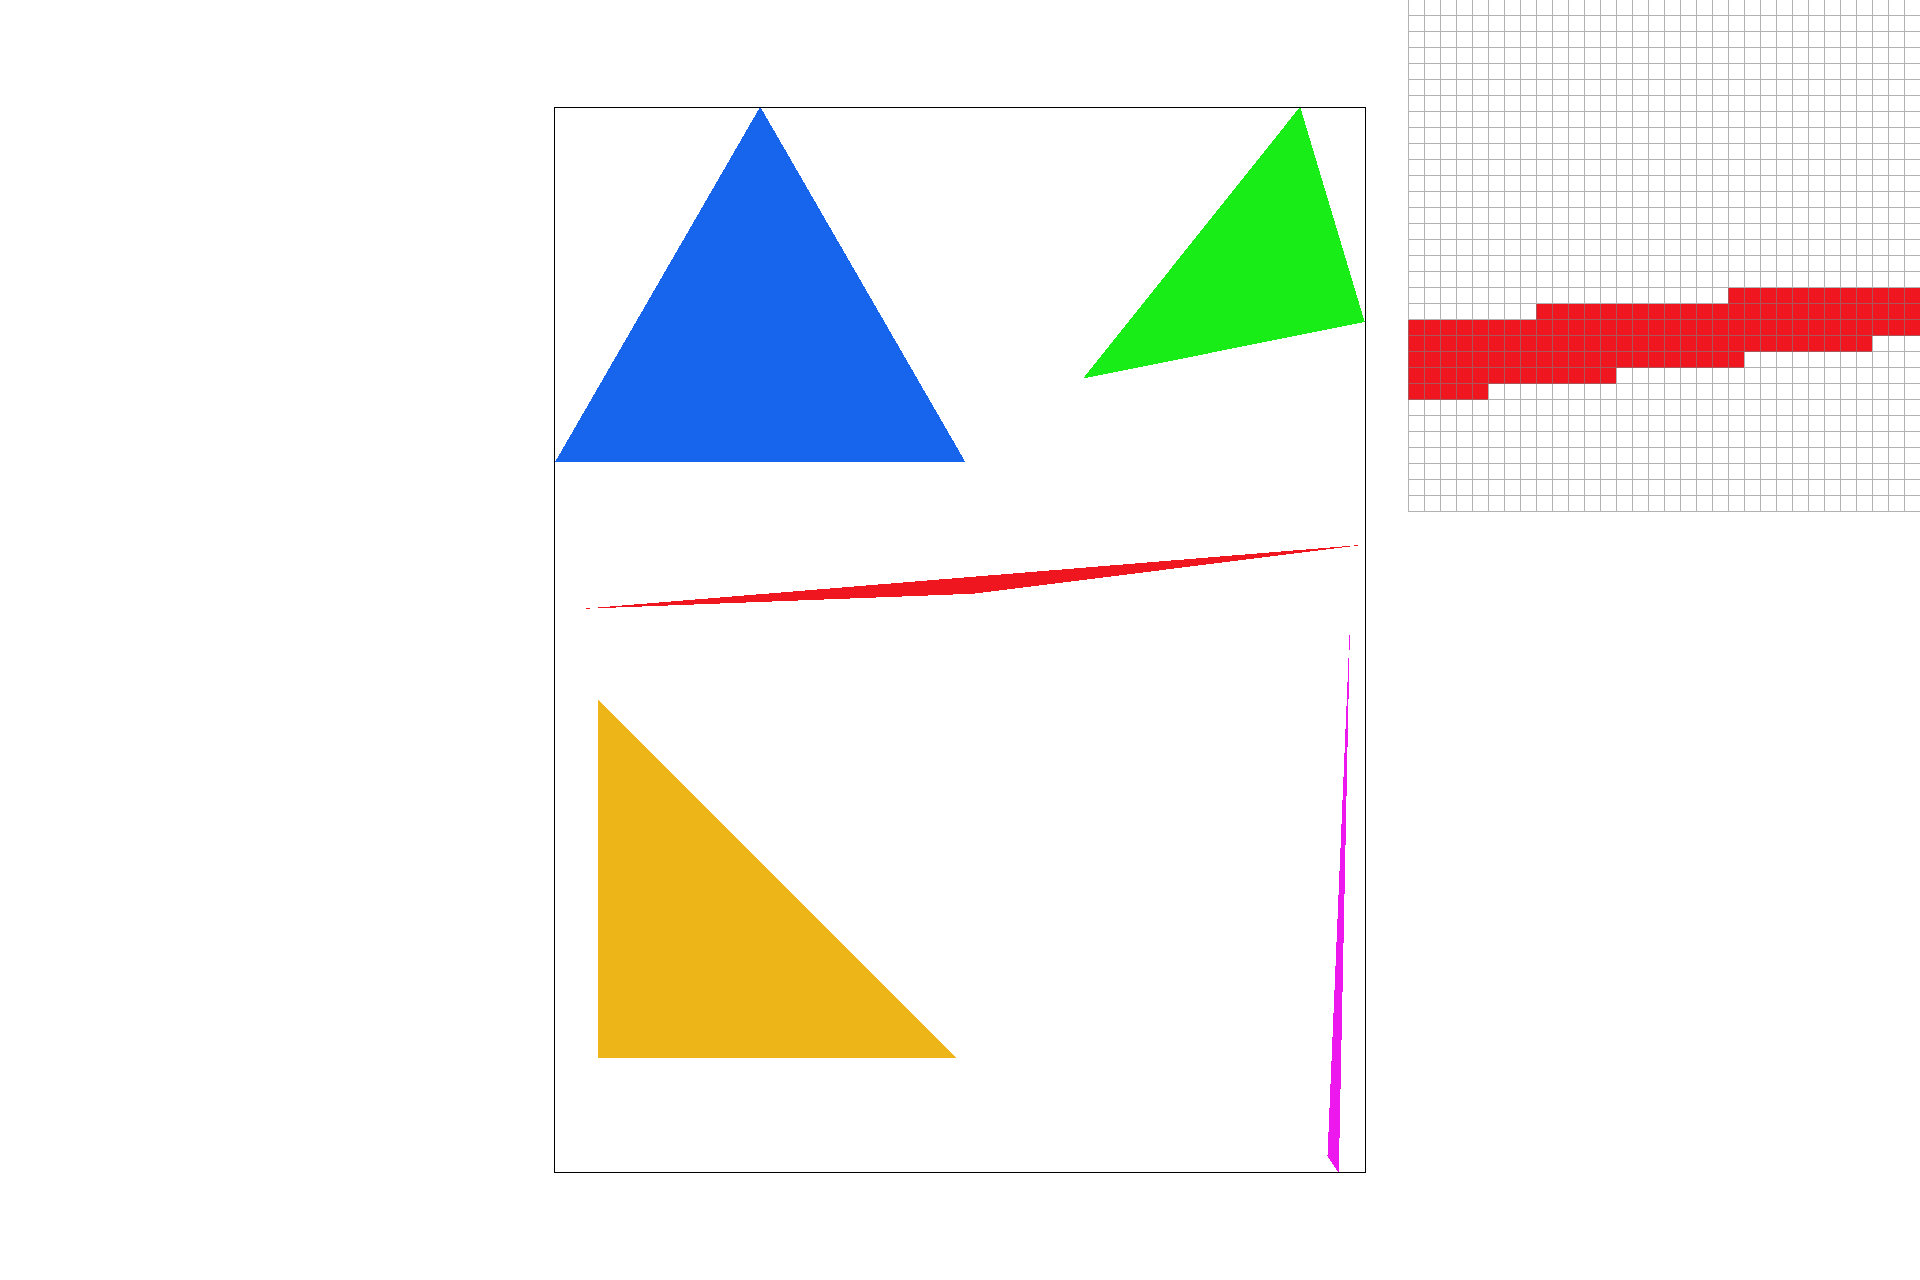
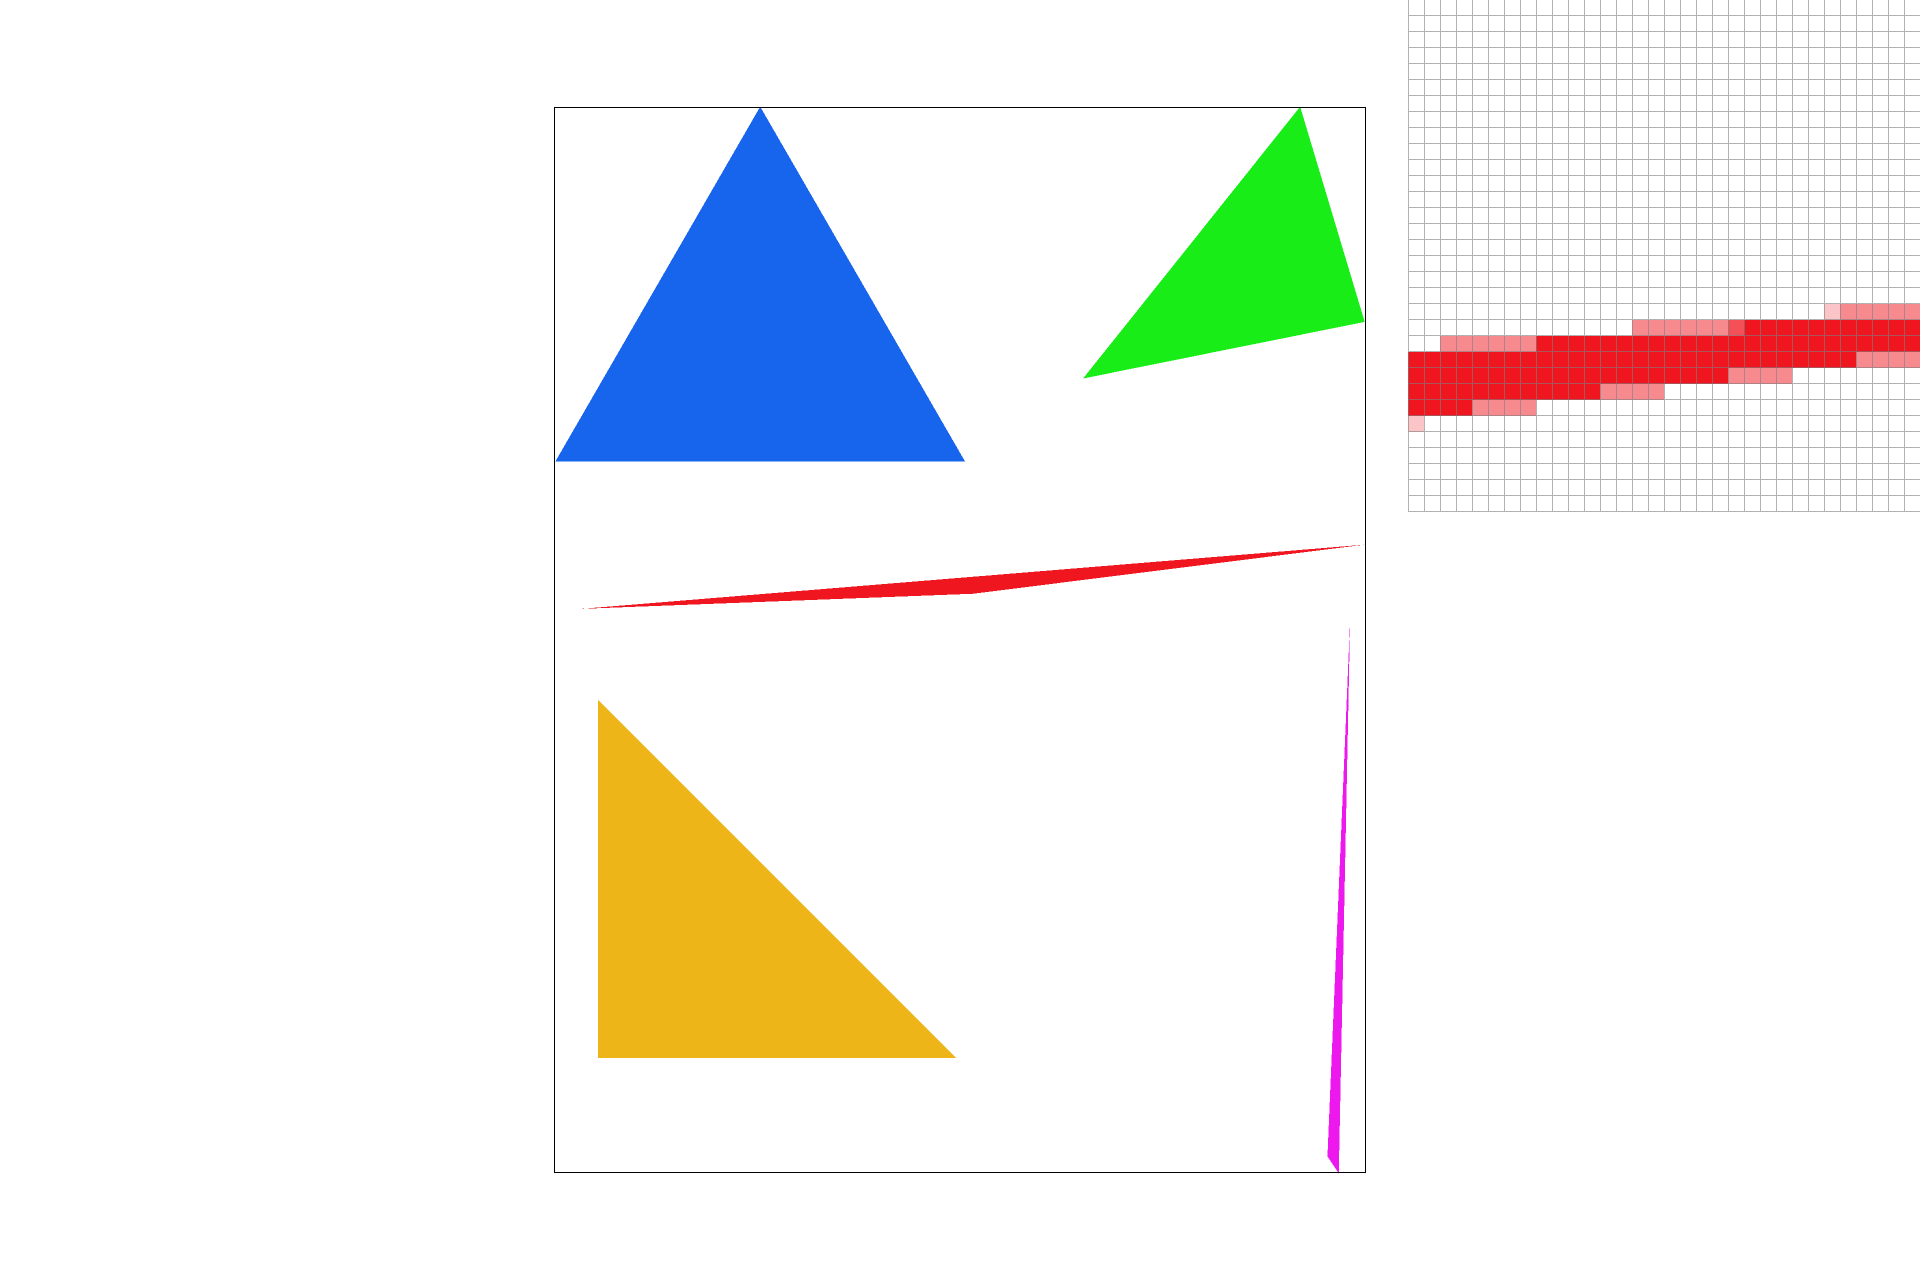
Here are screenshots of basic/test4.svg with the default viewing parameters and sample rates 1, 4, and 16 to compare them side-by-side.
Part 3: Transforms
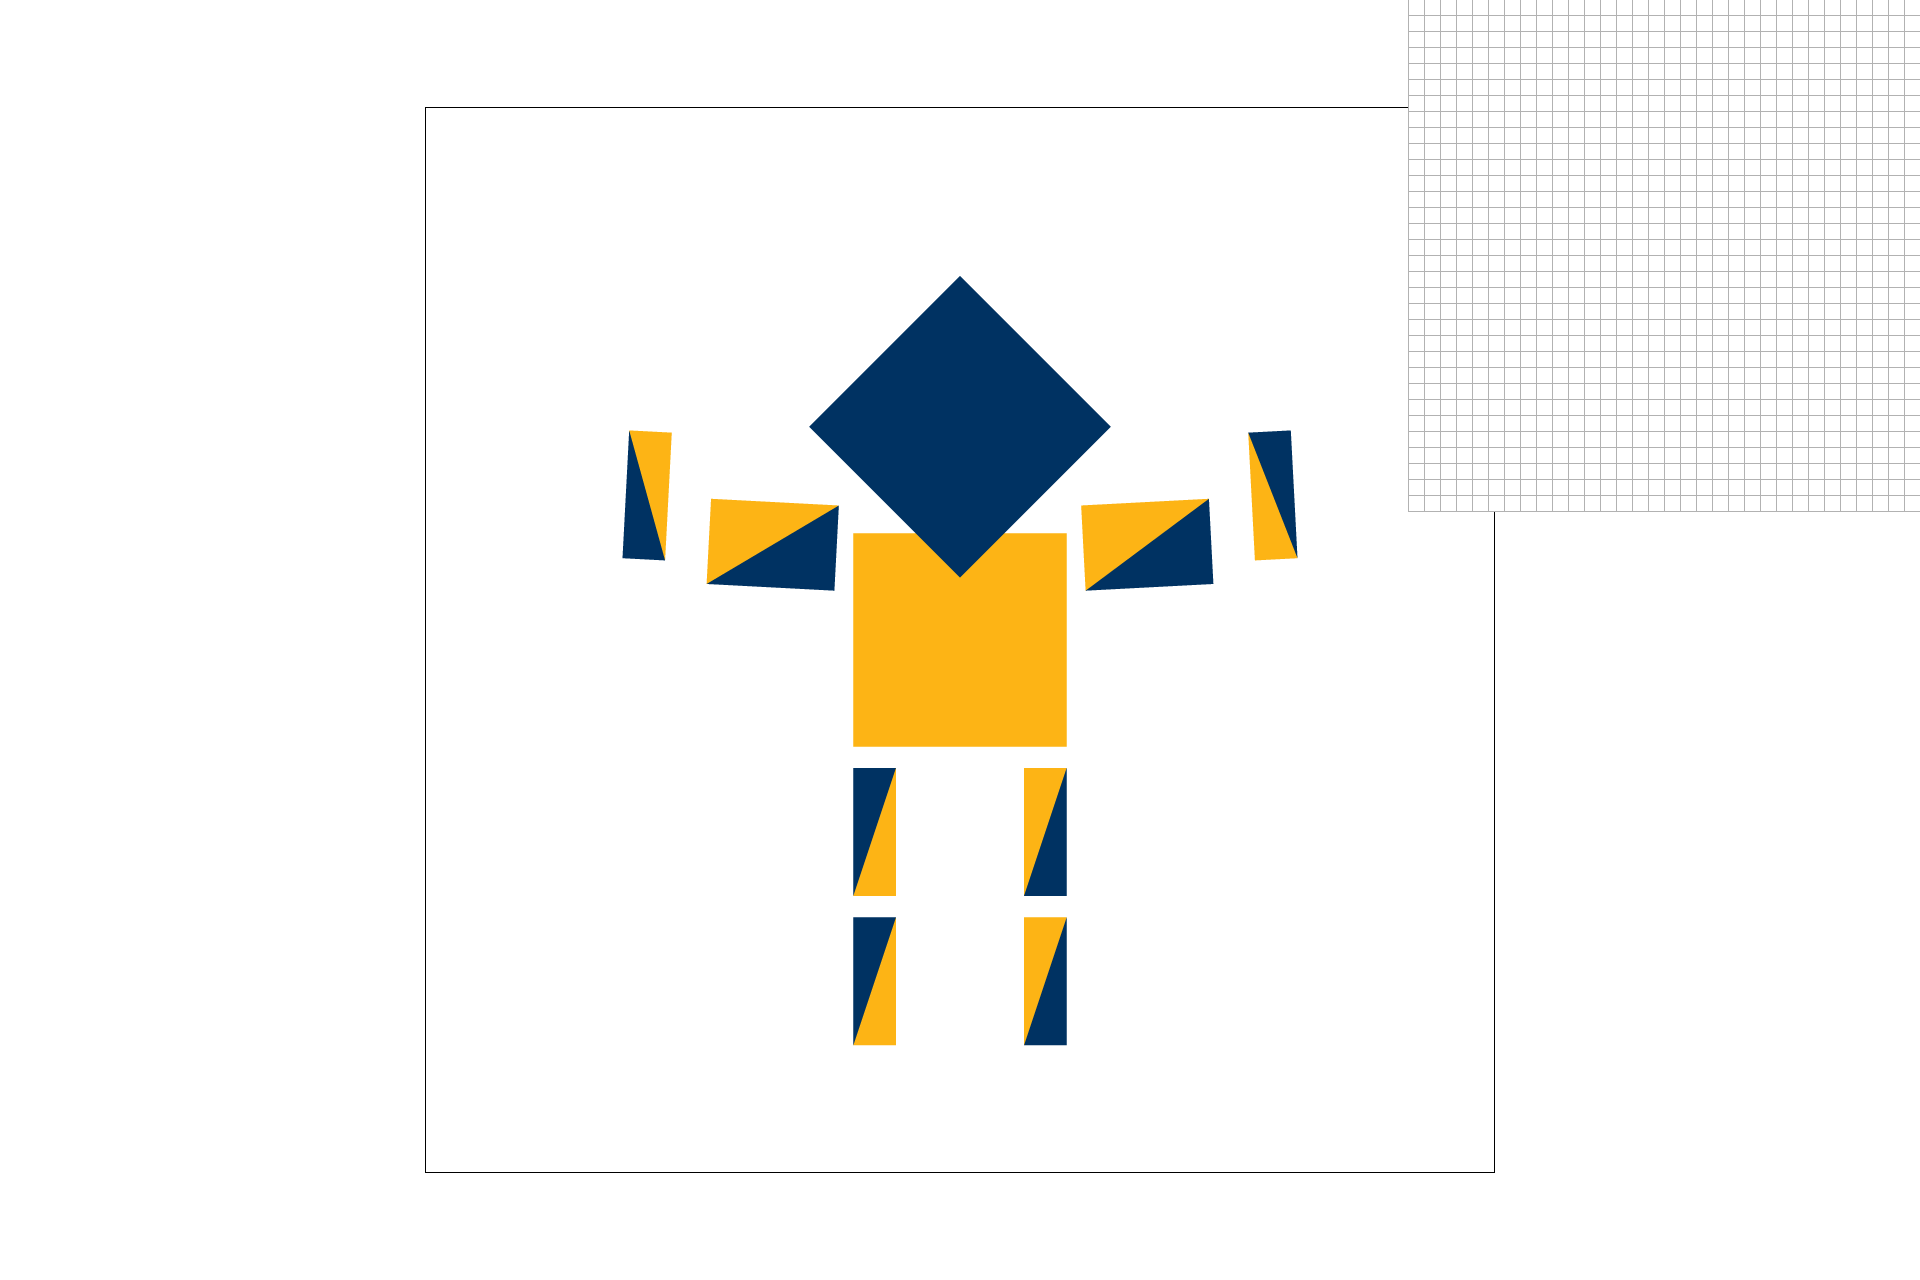
I have created an updated version of svg/transforms/robot.svg with cubeman doing something more interesting:
- I replaced the colors with UC Berkeley official colors, Berkeley Blue:
#003262and California Gold:#FDB515. - Since people at UC Berkeley are smart, I scaled his head to be twice as large in the x and y directions.
- I made his biceps bigger, because people here are very strong.
- Finally, I rotated his forearms to be in a "flexing" position. This meant also translating them so that there would not be too much of a gap between biceps and forearms.
Section II: Sampling
Part 4: Barycentric coordinates
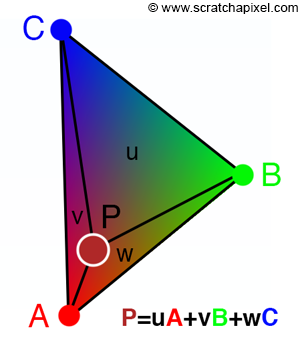
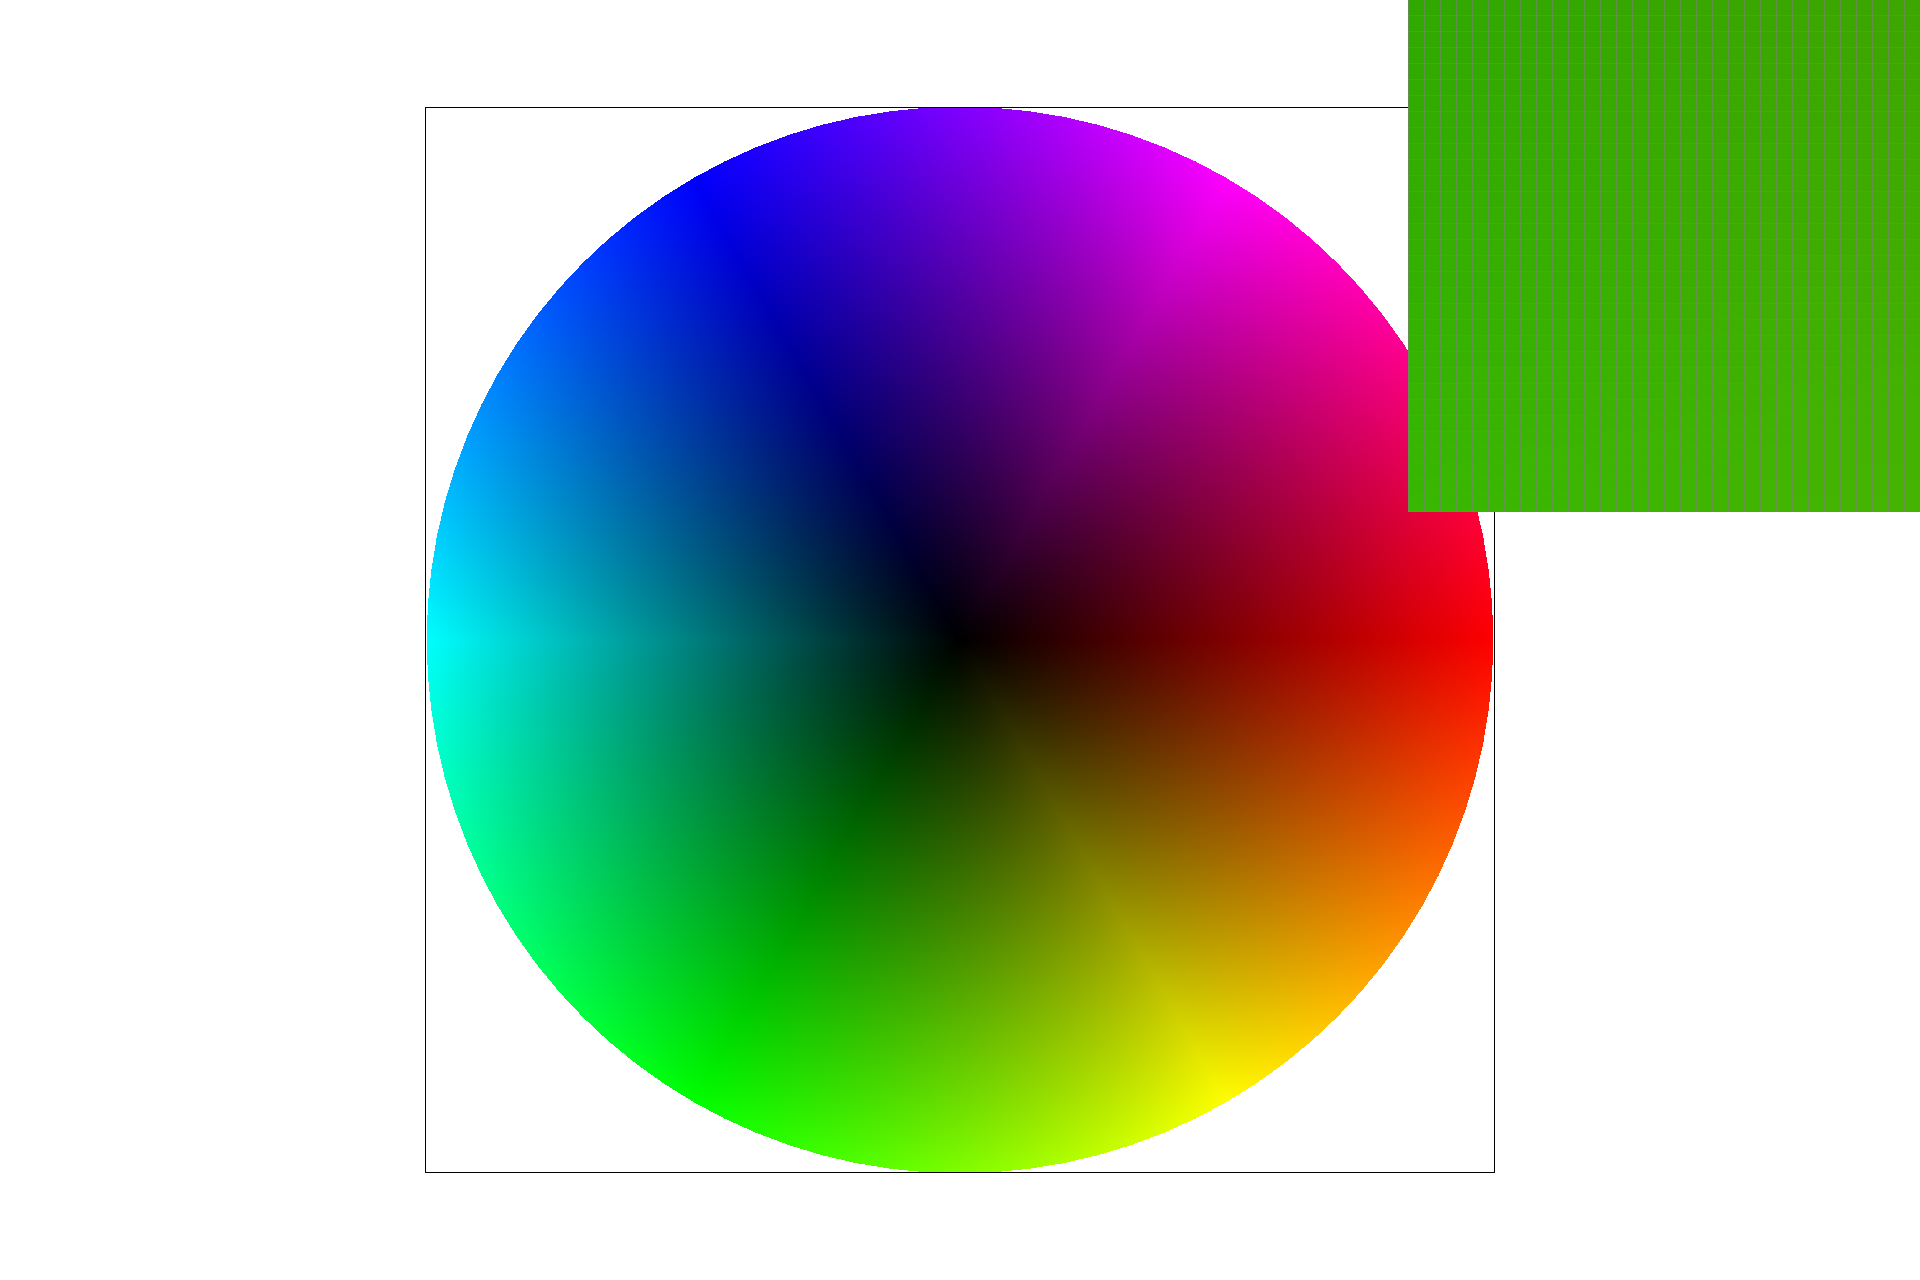
Barycentric coordinates describe the location of a point in relation to a triangle's three points. Usually the location of the three points are denoted by A, B, and C. So we can say(x,y) = uA + vX + wC. Using this coodinate system makes interpolating values much more straightforward as you can just do a weighted sum. For example, given three colors corresponding to A, B, and C respectively, we can say that the point P has u*A redness and v*B blueness.
Part 5: "Pixel sampling" for texture mapping
Pixel sampling can be applied to the texture plane rather intuitively. Given a triangle in (u,v) coordinates, and a texture in (u, v) coordinates, you can still retrieve a color for your given (x,y) coordinates. You simply convert to barycentric coordinates as before, and see what values of (u,v) you end up with. The challenge comes in deciding which pixel, say (55.2758, 88.412), corresponds to.
- Nearest-pixel sampling involves simply taking the pixel value that corresponds to the closest texel (pixel in the uv plane).
- Bilinear sampling involves taking the weighted average (linear interpolation) of the four closest texels.
Here is an image for which bilinear sampling clearly defeats nearest sampling. From top-left to bottom left, the images are:
- Nearest-pixel sampling with supersampling at 1.
- Nearest-pixel sampling with supersampling at 16.
- Bilinear sampling with supersampling at 1.
- Bilinear sampling with supersampling at 16.
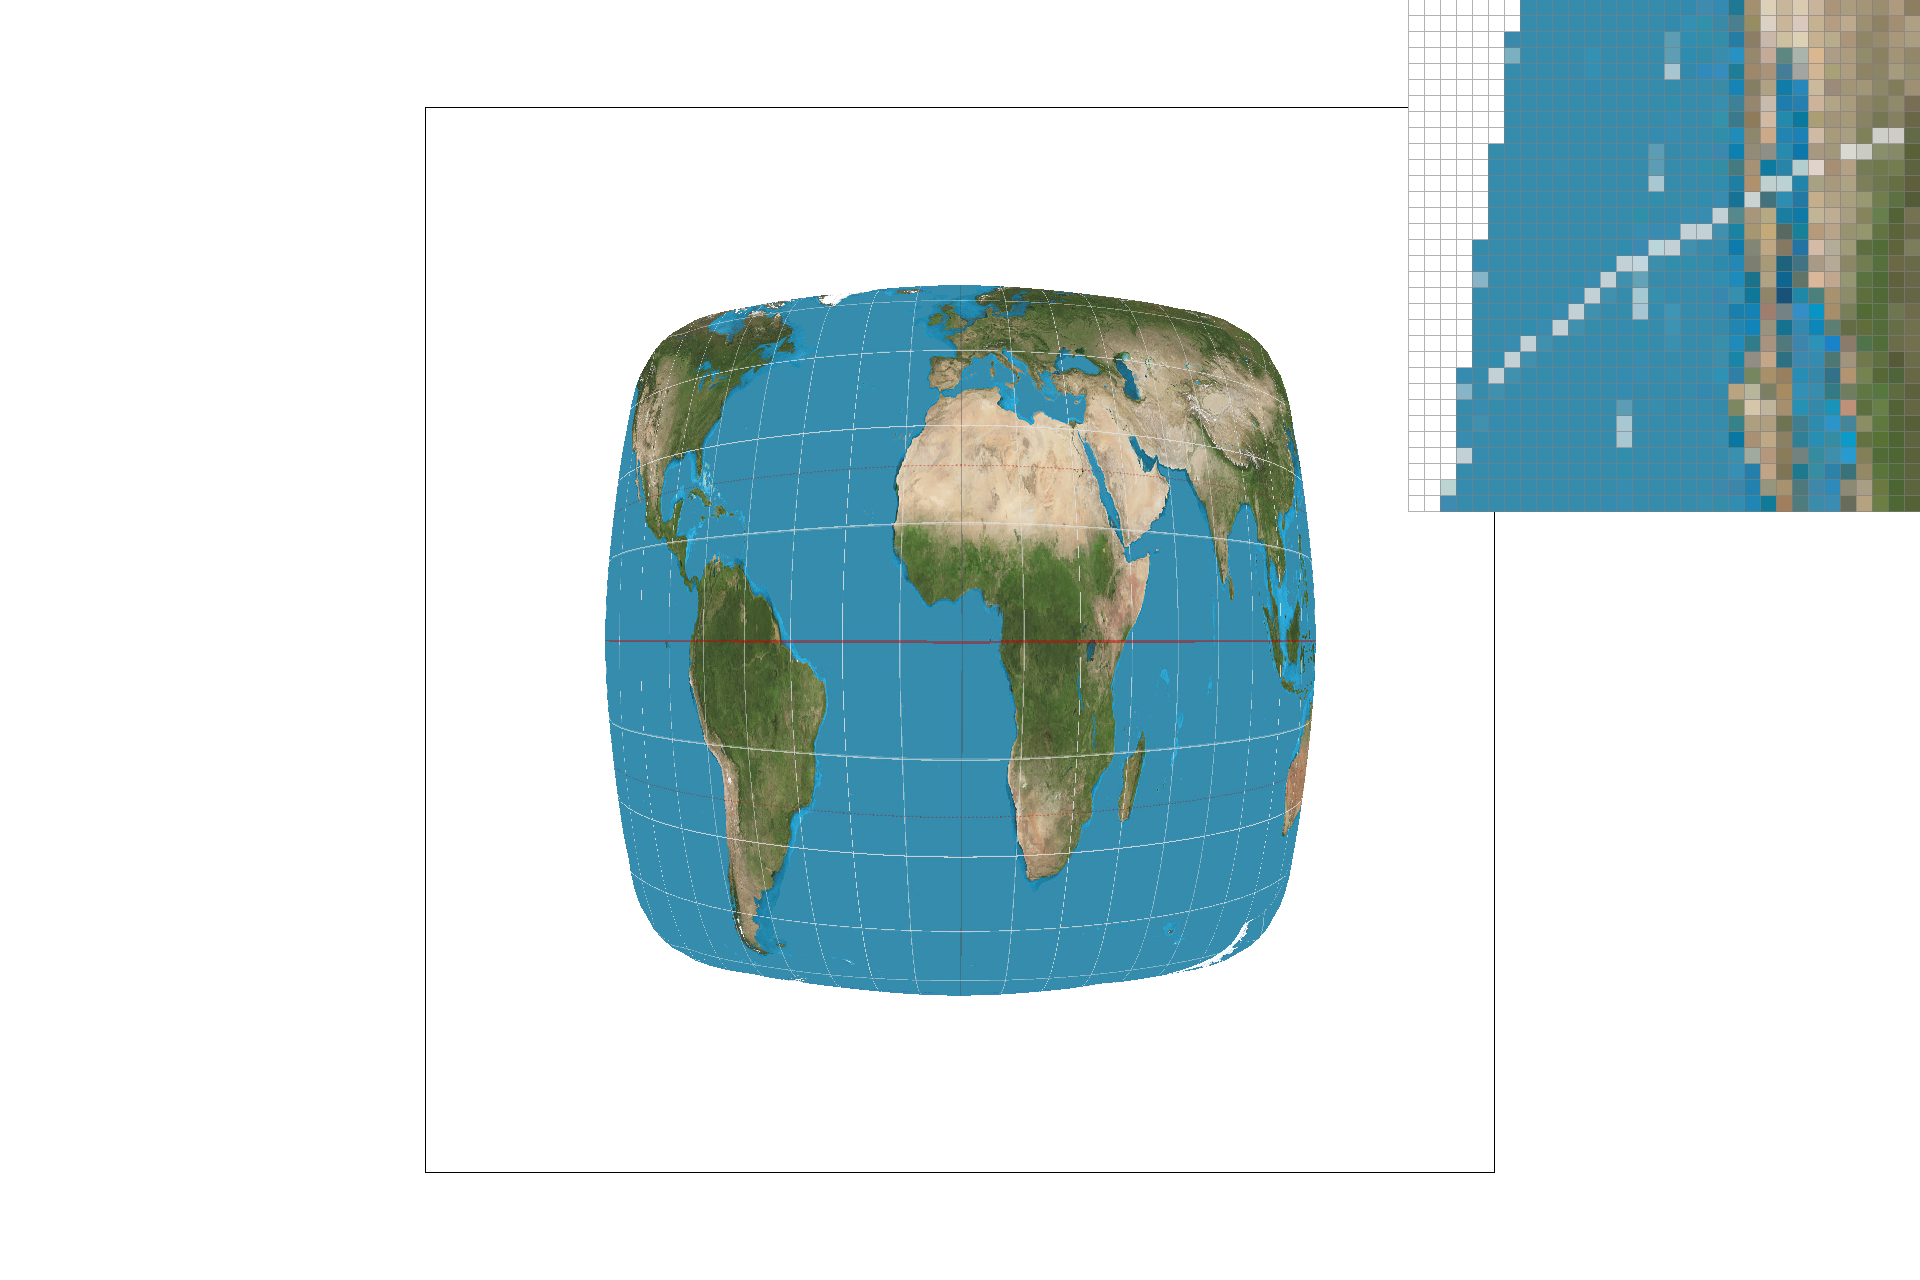
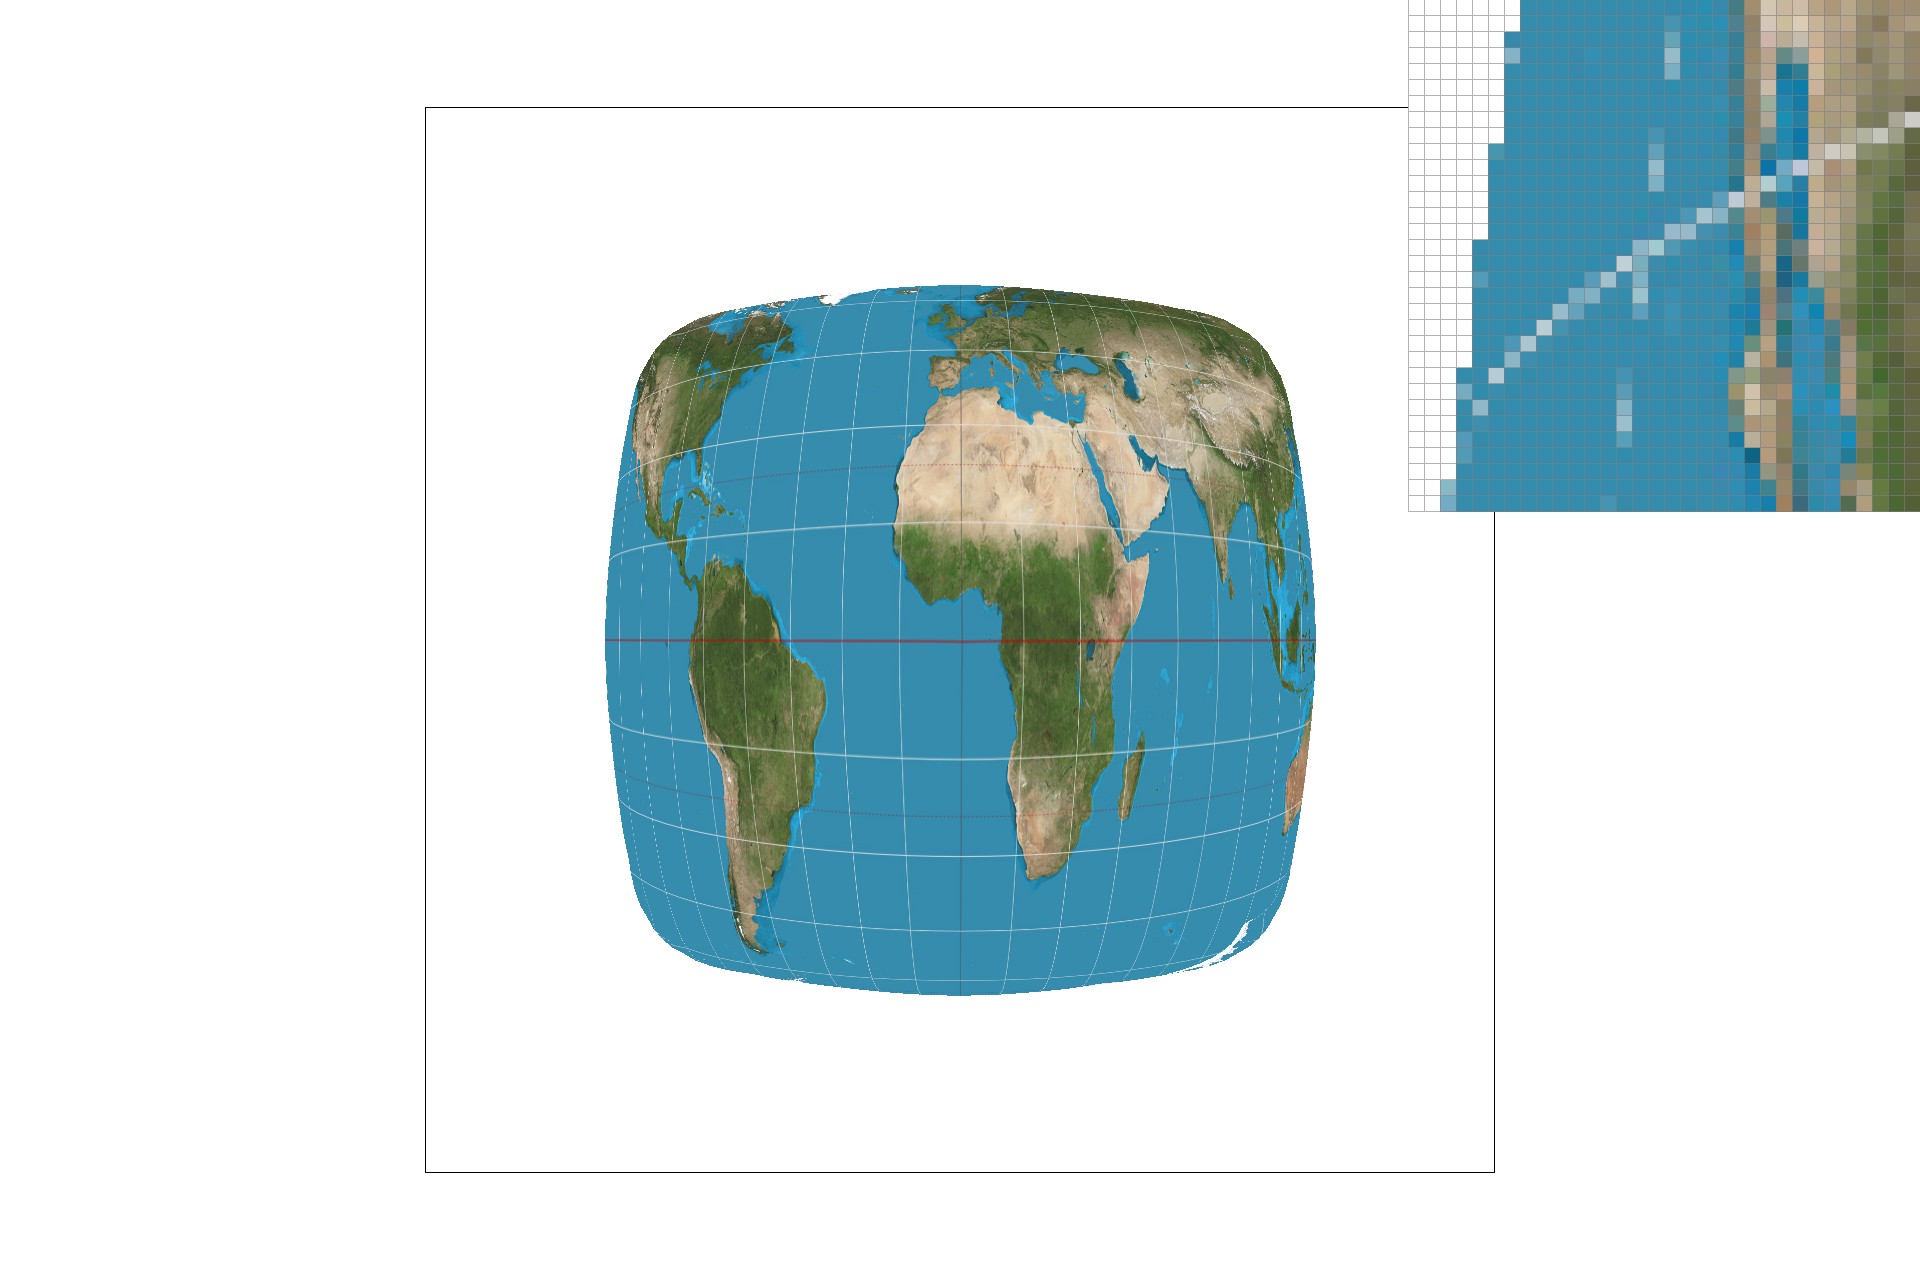
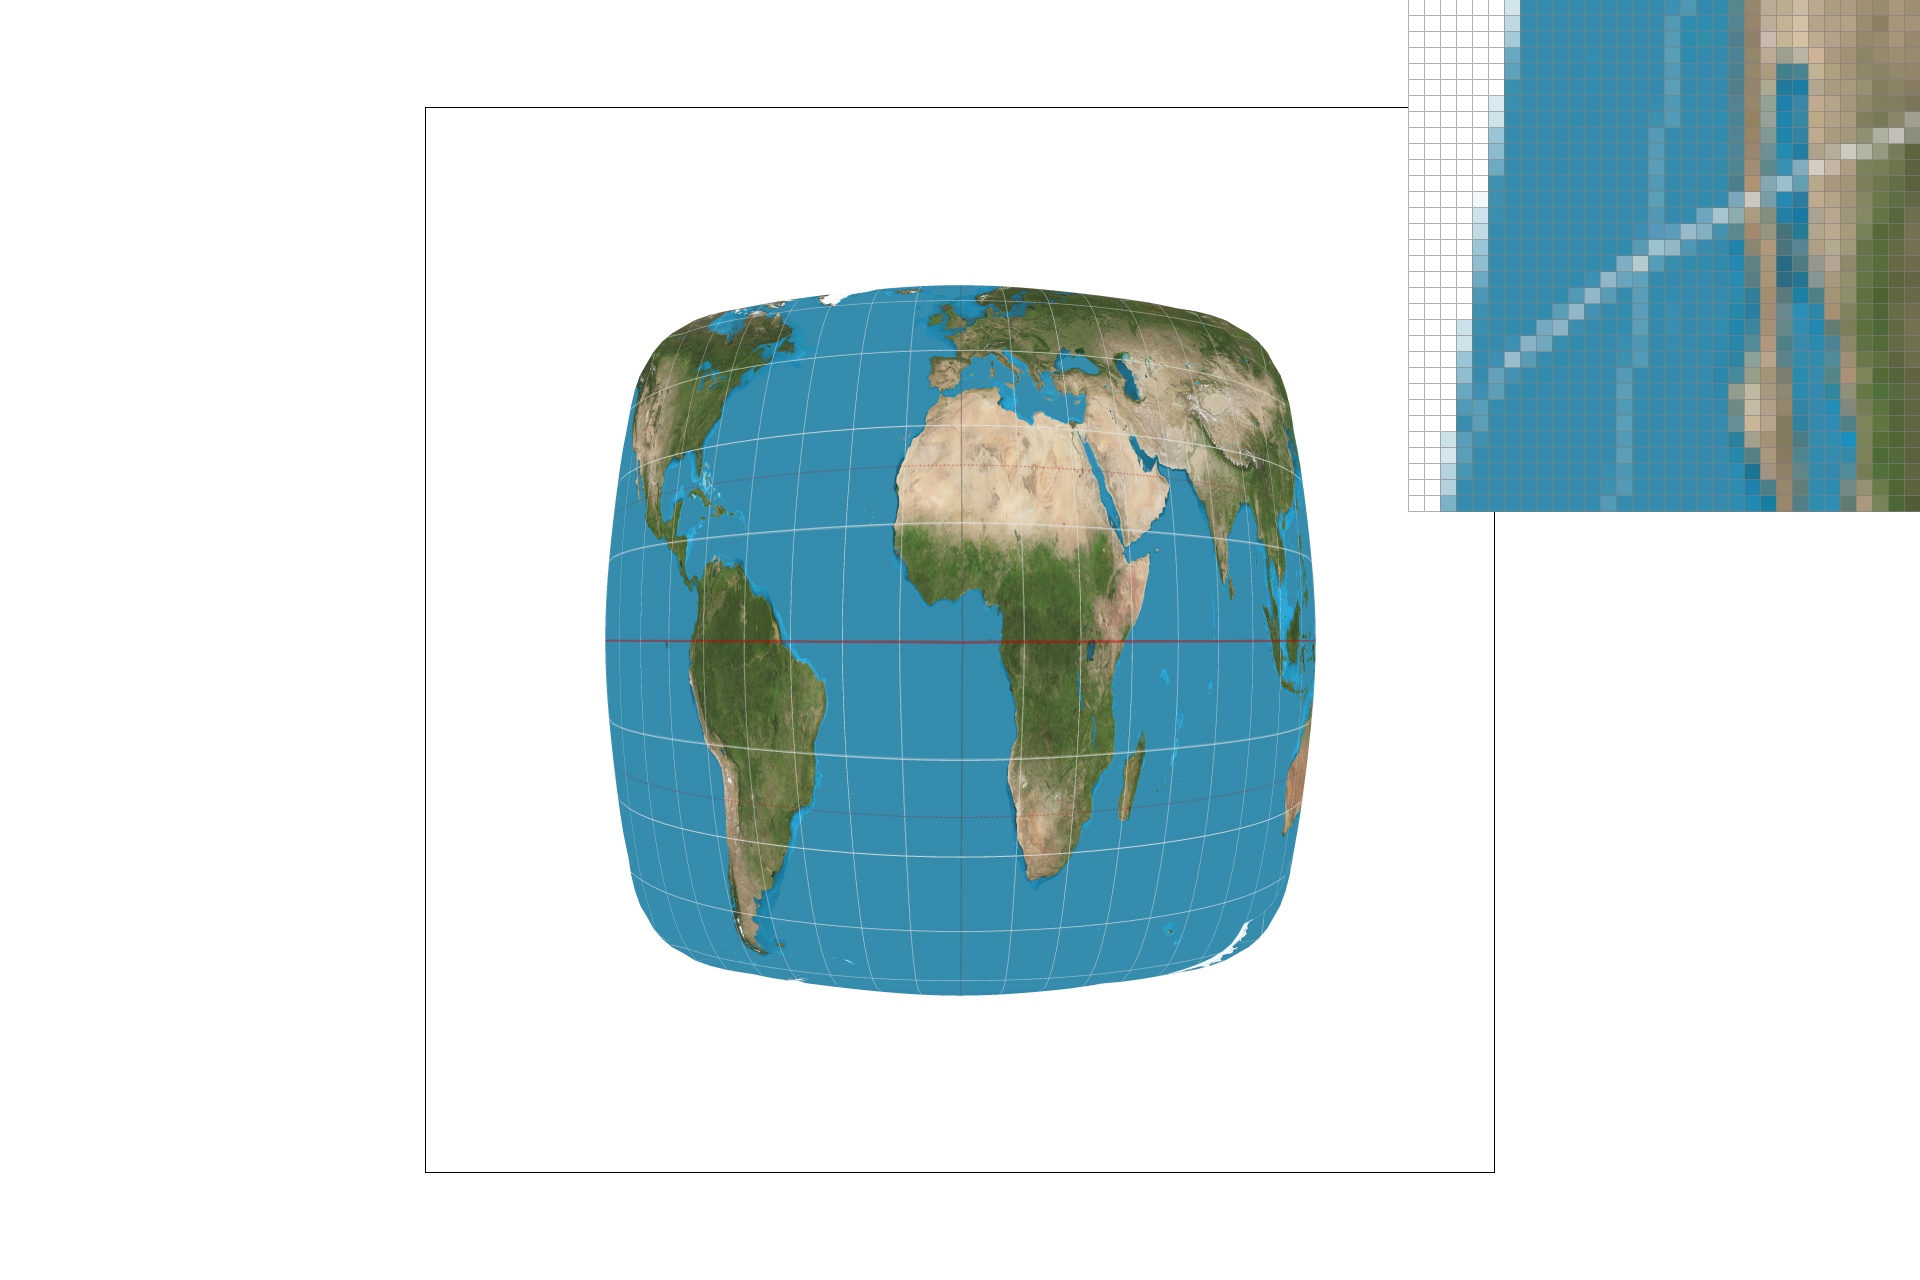
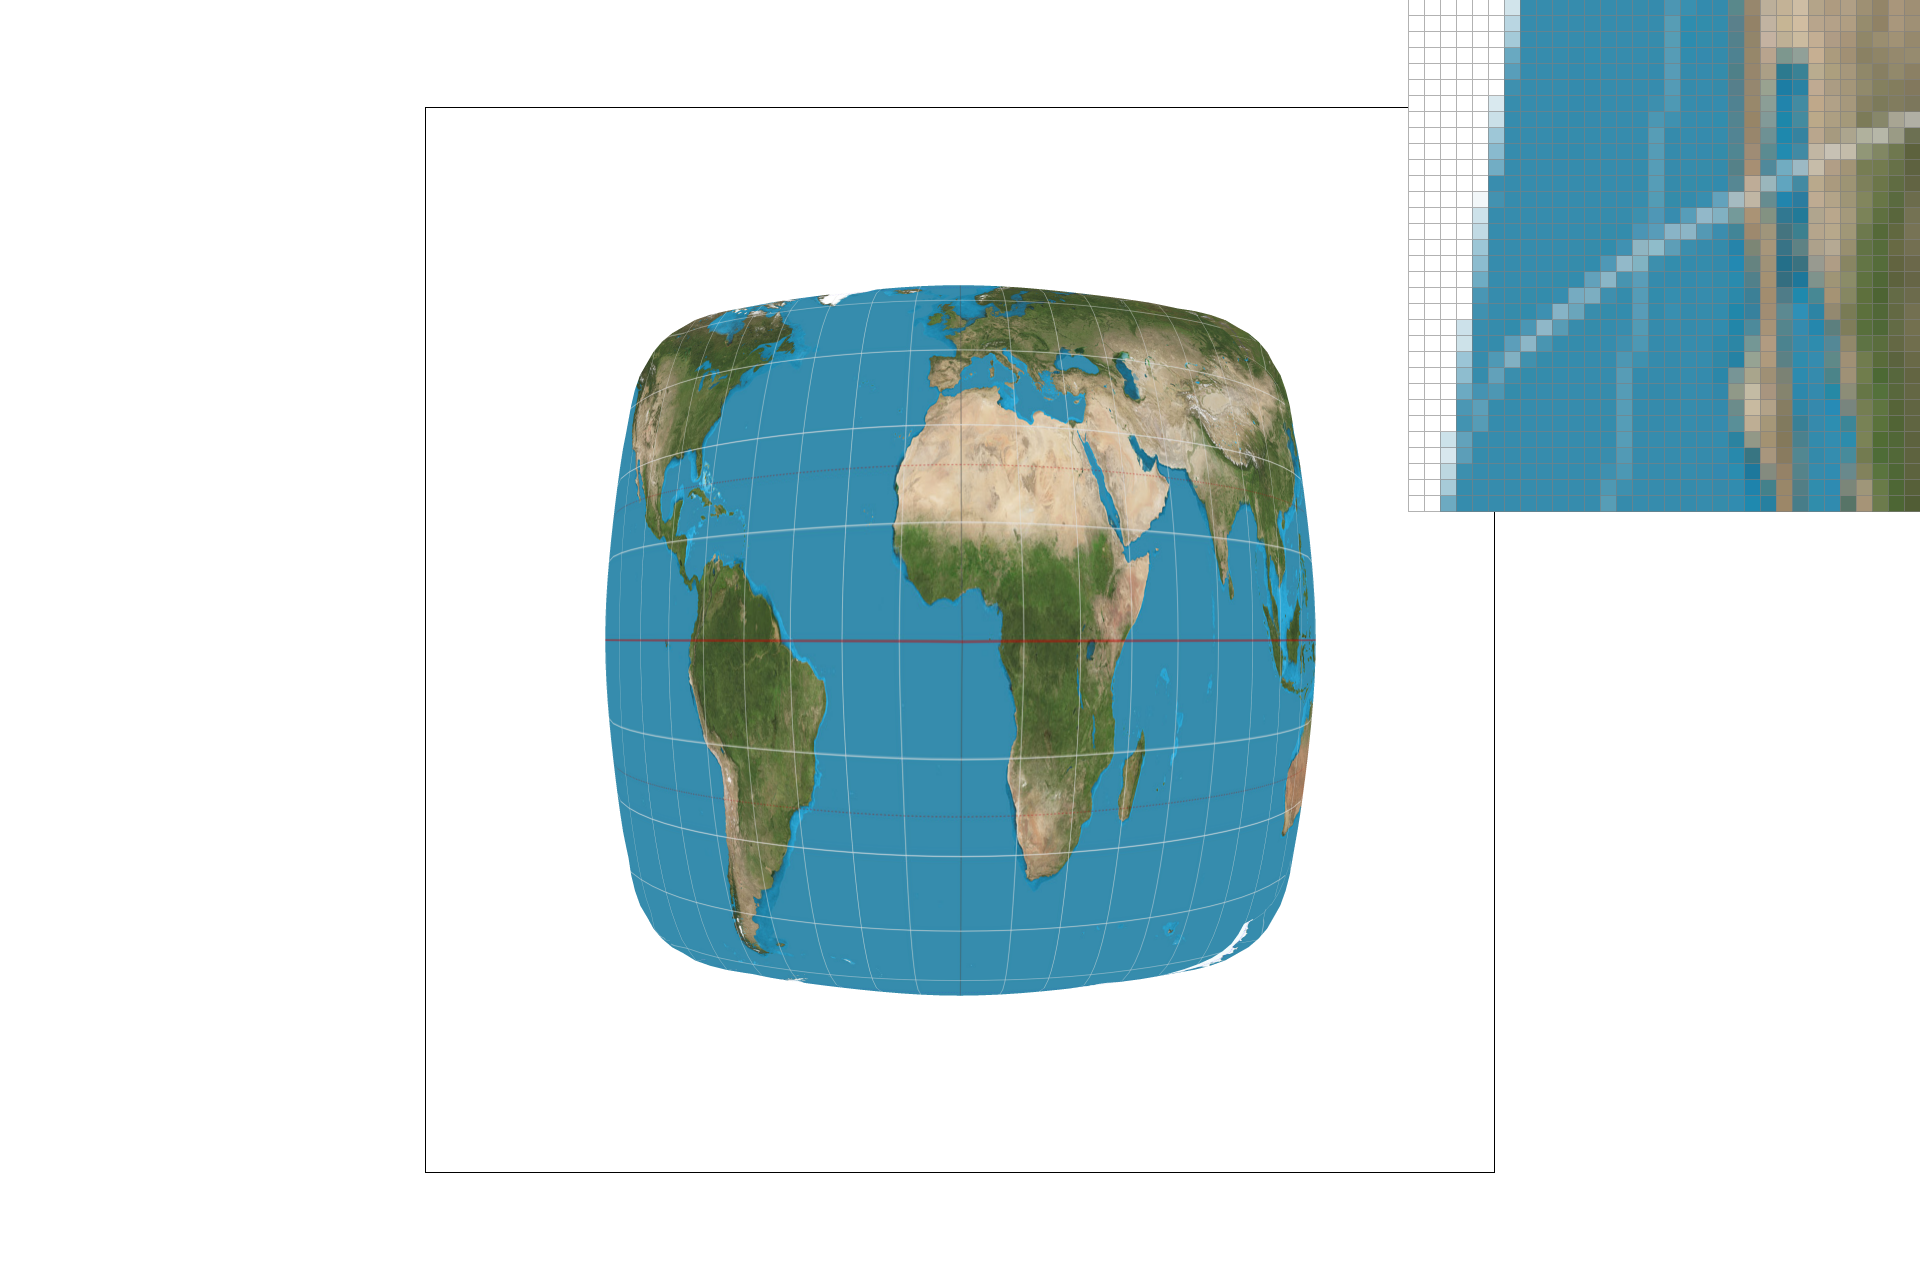
The differences are that lower sampling rates create more "jaggies" and other frequency-related distortions, and that bilinear sampling can further mitigate frequency-related distortions, at the risk of undesired blurriness.
There will be a large difference between nearest-pixel and bilinear sample when "jaggies" and other frequency-related distortions are most prominent. By averaging between 4 pixels, bilinear sampling avoids missing out on data where the texture is a higher frequency than the sample rate. Of course, the only true way to miss out on no data would be for your texture frequency to exactly match what your screen's pixels can show.
Part 6: "Level sampling" with mipmaps for texture mapping
Level sampling involves sampling from mipmap levels rather than the original texture. The point is to use appropriately-sized versions of the same texture in order to save computation and to avoid frequency-related distortions.
I implemented it by seeing how far away (x+1,y) and (x, y+1) end up being in the texture plane. A larger maximum distance corresponds to a higher (smaller and more blurry) mipmap level. Then that mipmap level is passed to the functions for pixel interpolation, rather than the full-scale texture.
But the output of the get_level function is usually in between two levels. So you can either round to the nearest level, or in the case of bilinear level sampling, calculate the color from both levels and take the linearly interpolated average.
I have applied my code to a custom png. From top-left to bottom left, the images are:
- Level 0 with nearest pixel sampling.
- Nearest level with nearest pixel sampling.
- Level 0 with bilinear sampling.
- Nearest level with bilinear sampling.
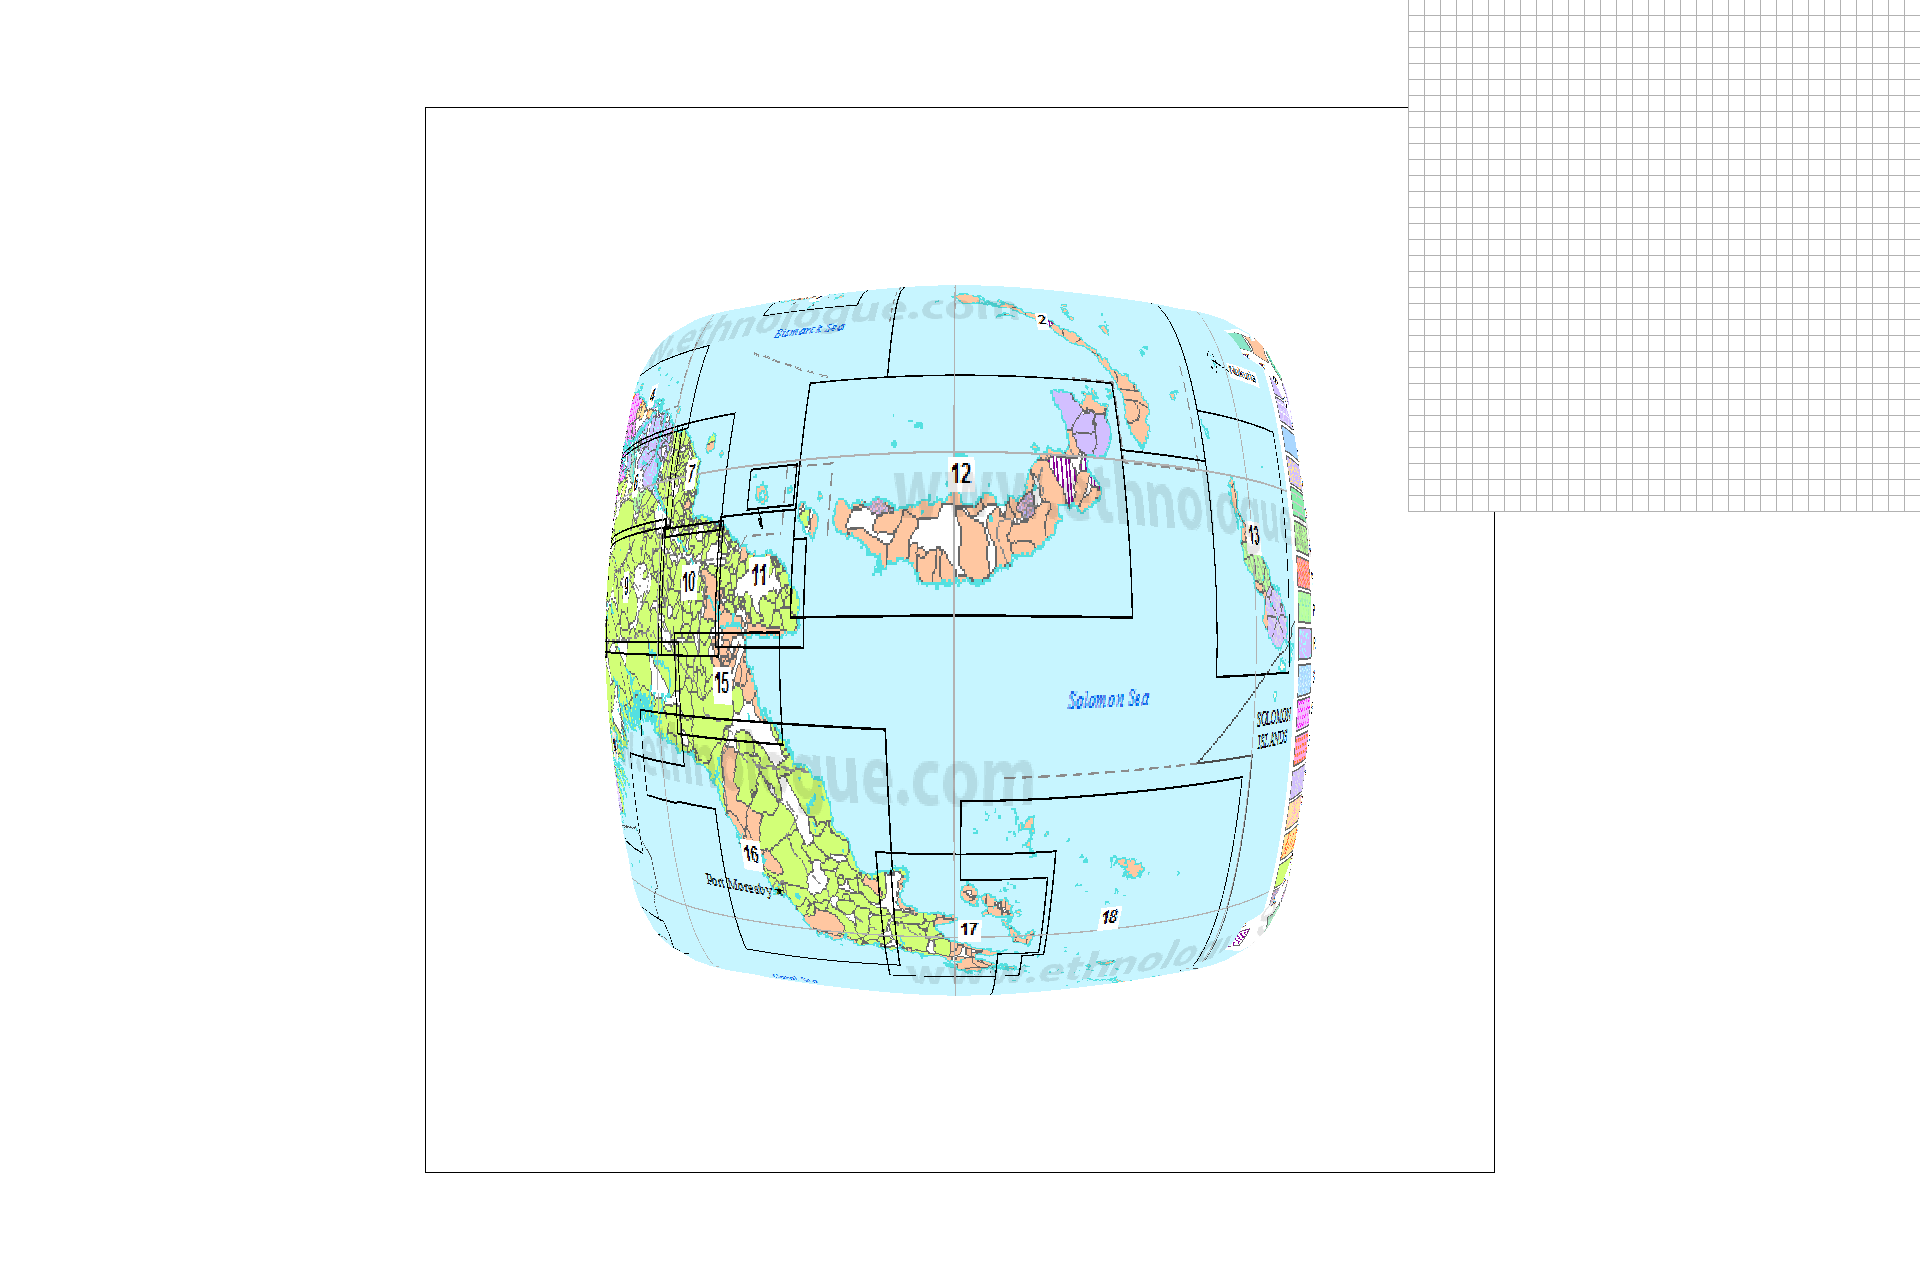
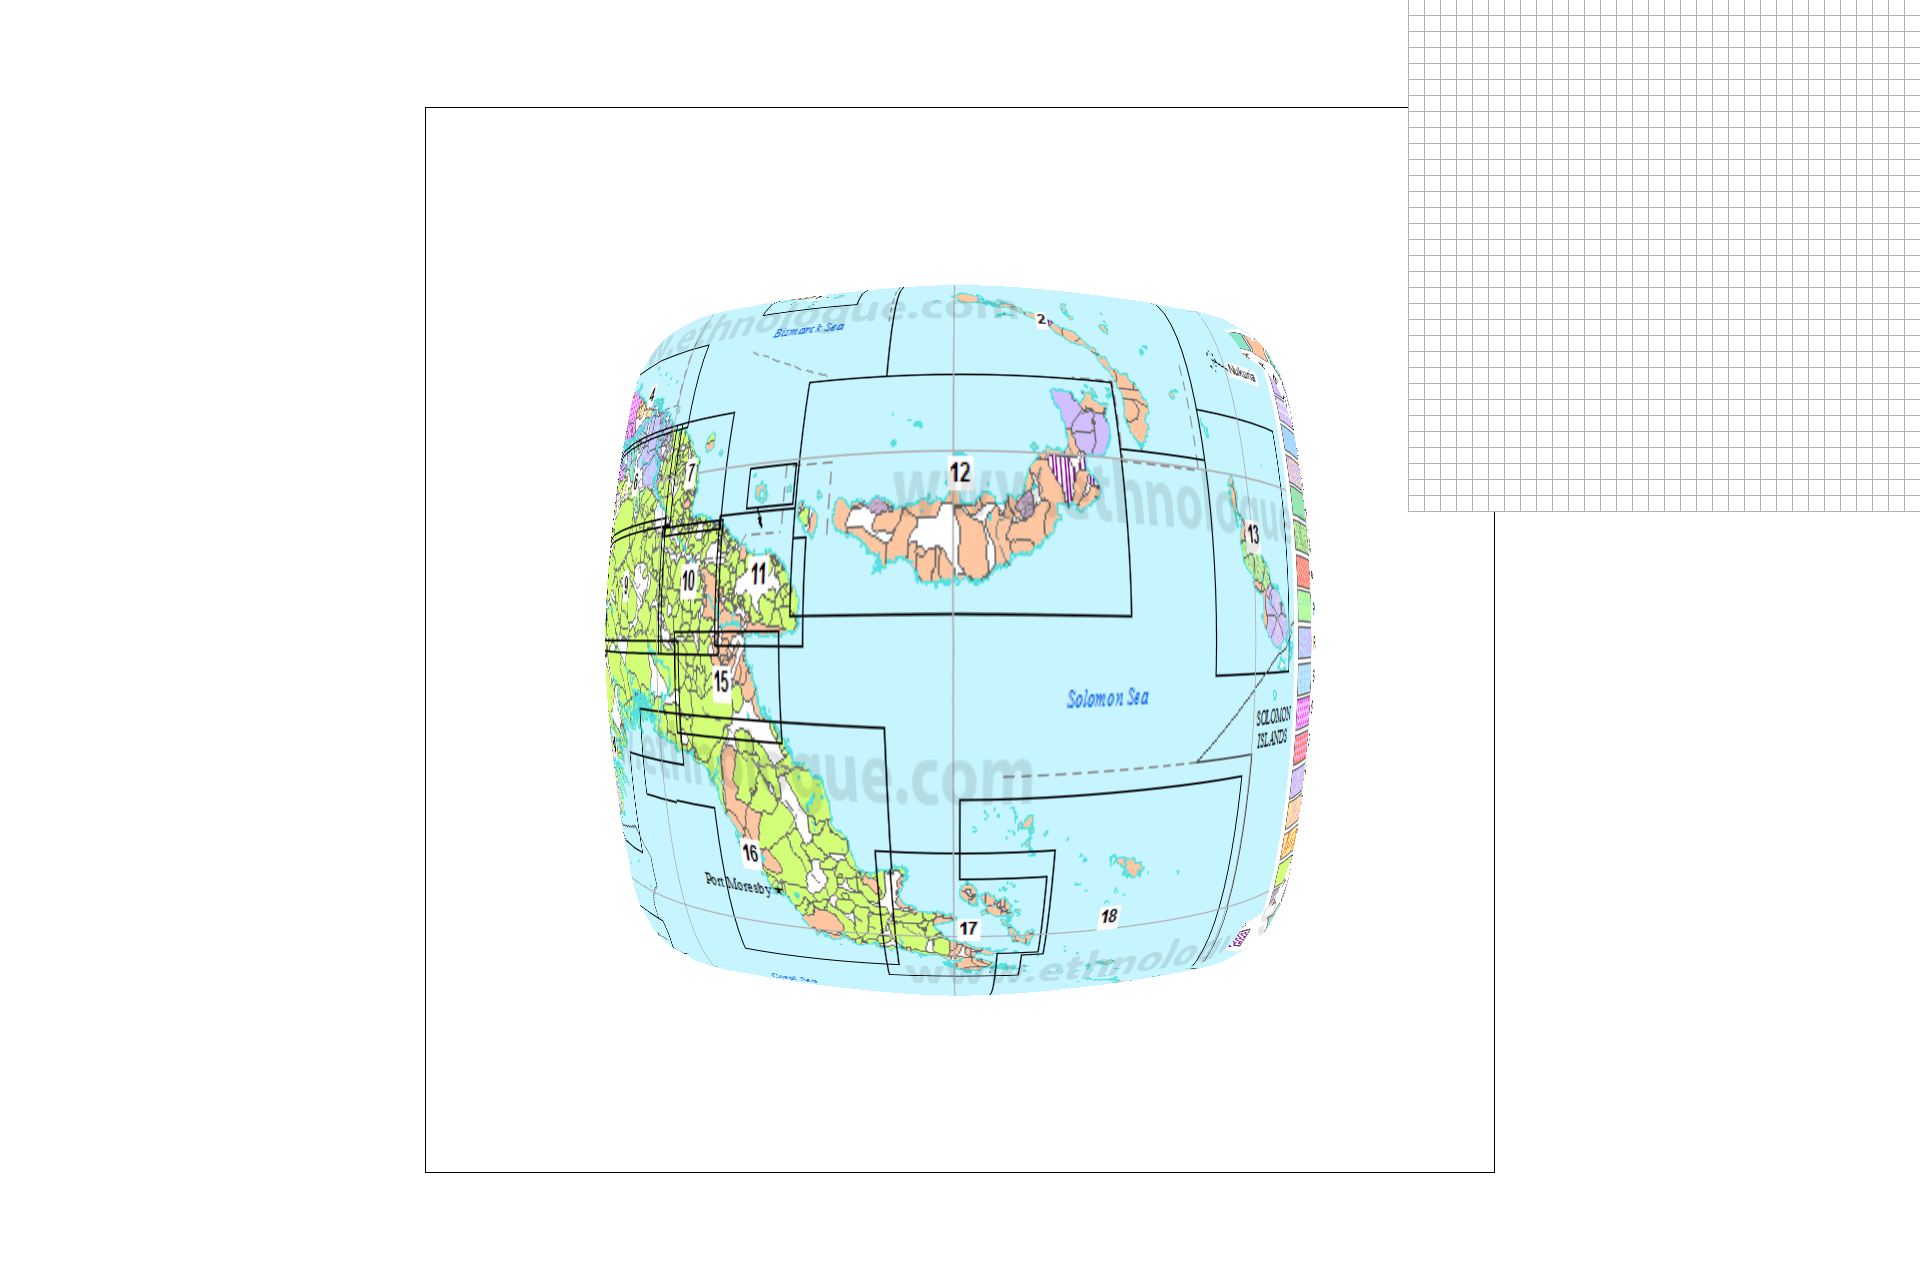
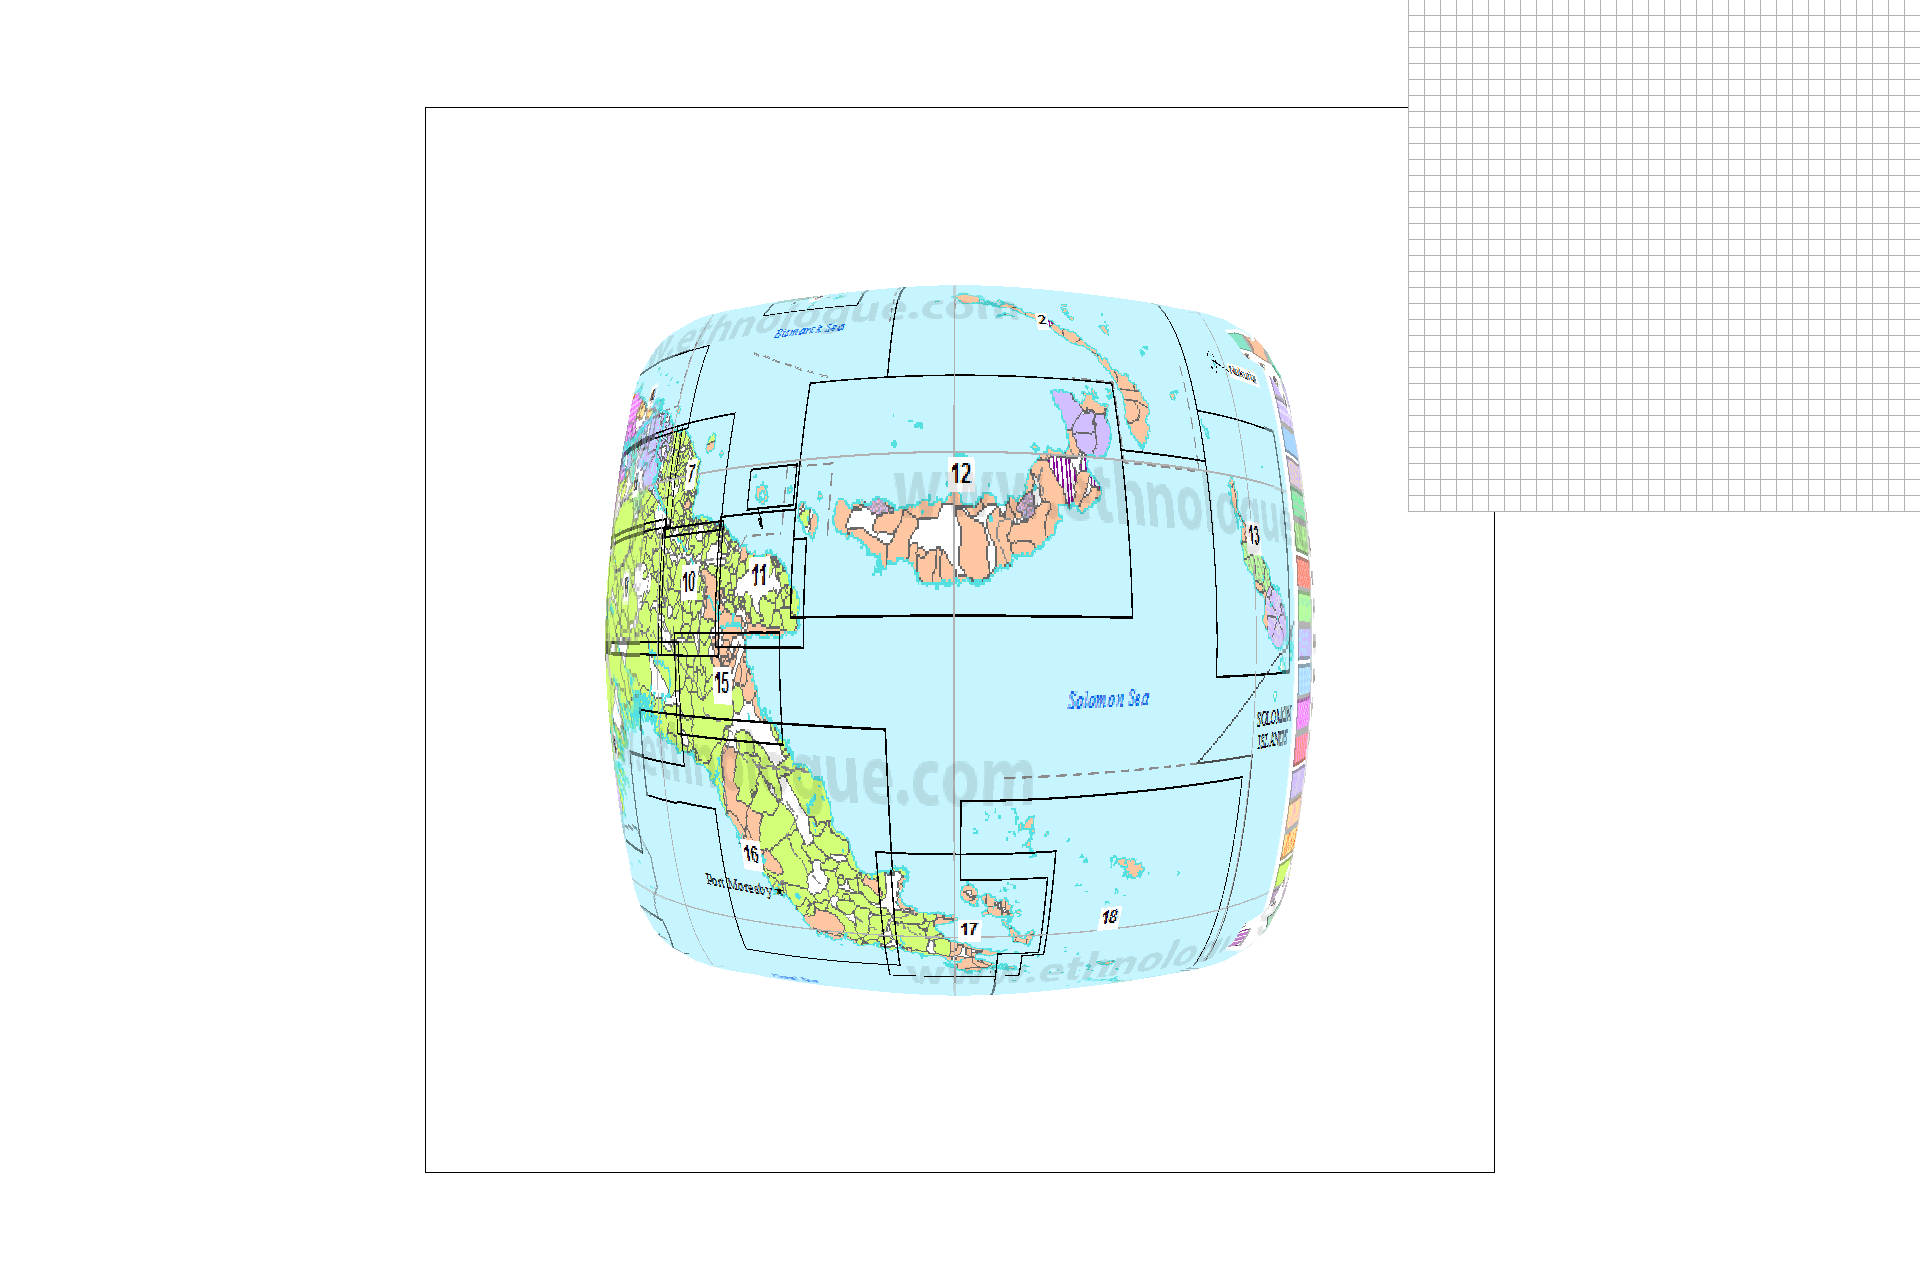
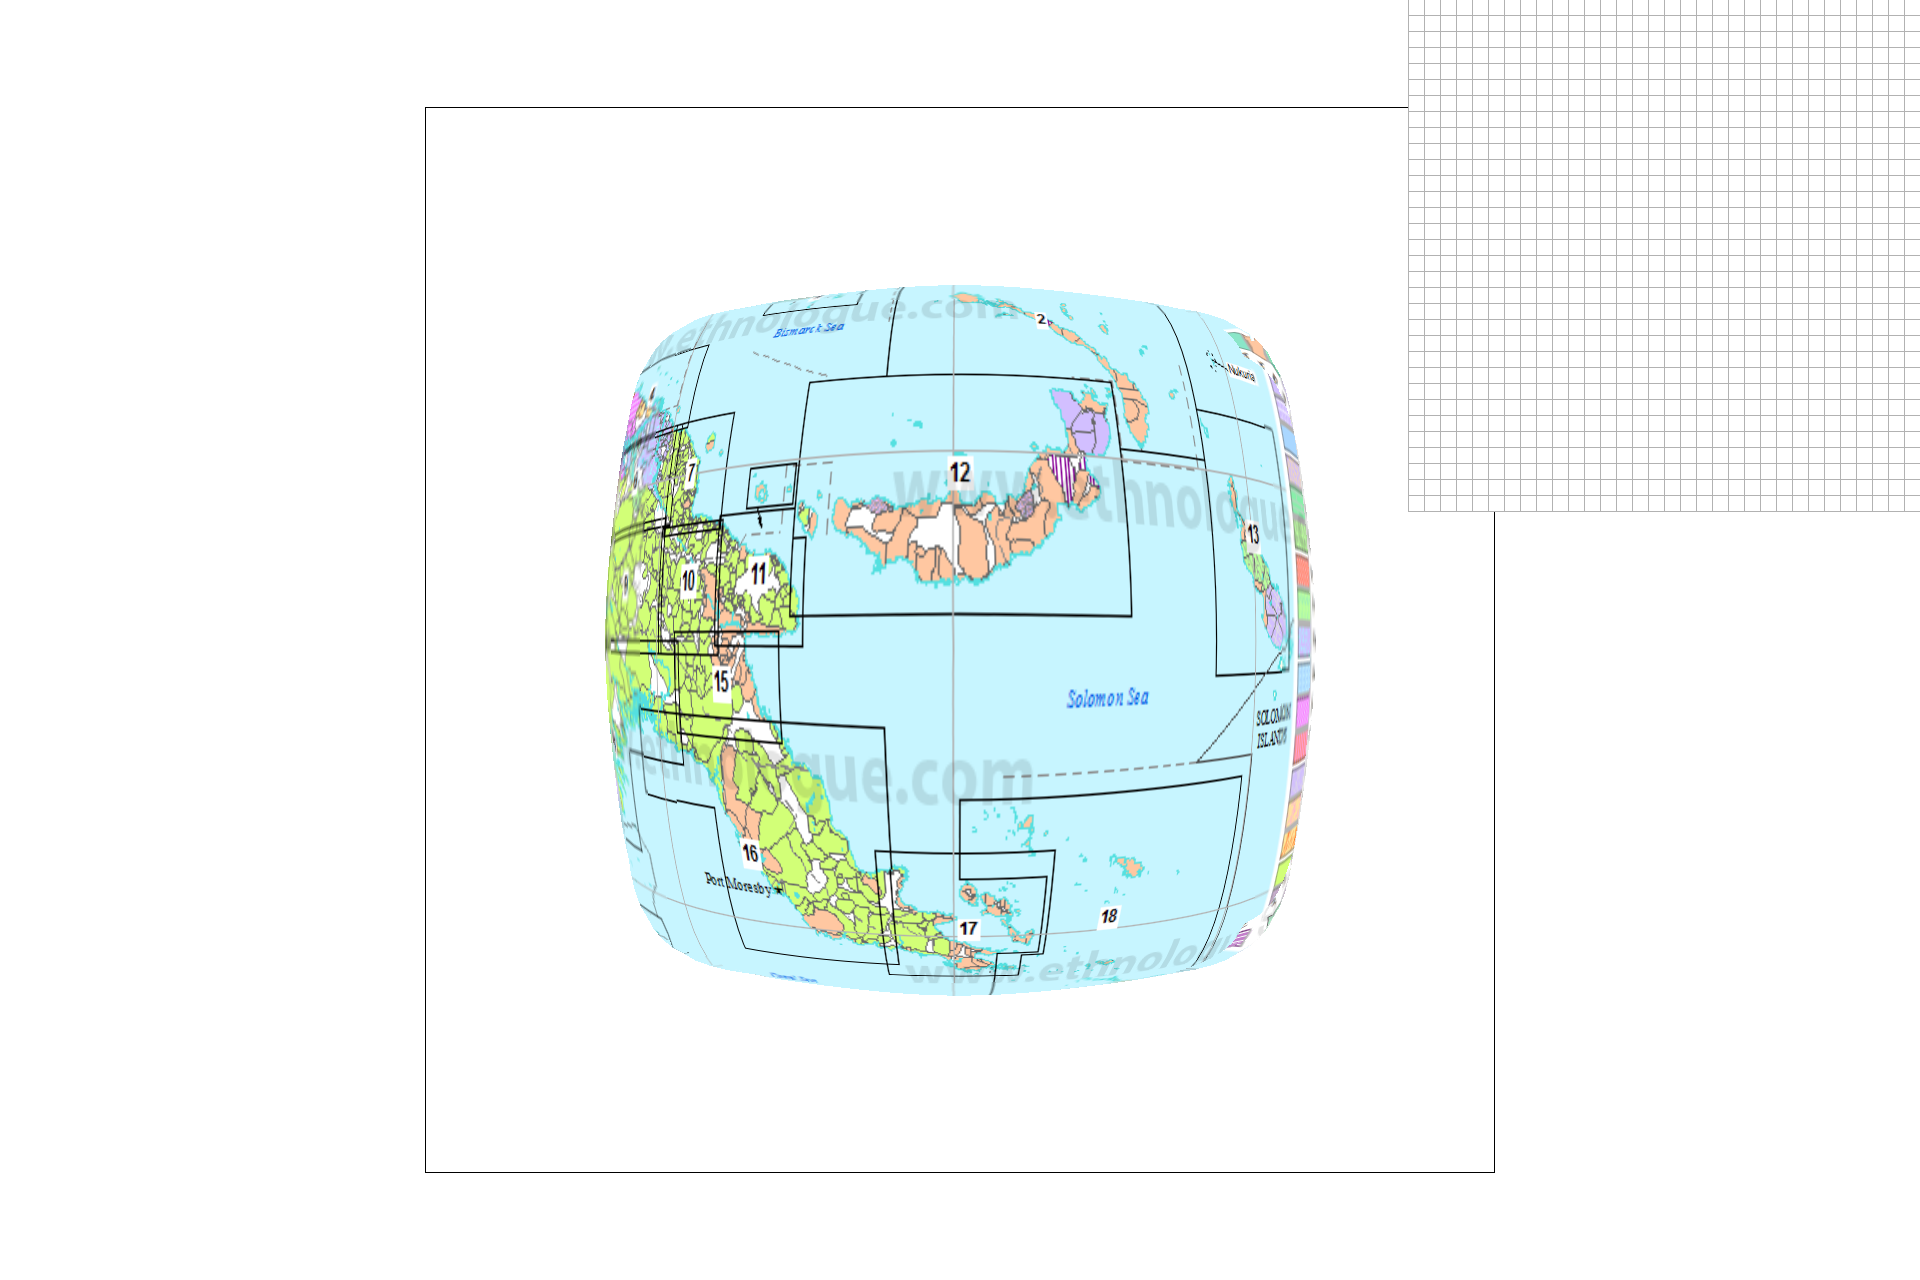
The tradeoffs are as follows:
- Bilinear level sampling is the slowest and has the most antialiasing power out of the level sampling options.
- Level 0 level sampling is the most memory-hungry since it doesn't take advantage of the mipmap and it also has the least antialiasing power.
- Out of the sampling options, nearest-pixel sampling is worse at anti-aliasing but the faster of the two.
- Bilinear sampling is slower but does perform anti-aliasing nicely.
- The effects compound on each other. In other words, bilinear level sampling combined with bilinear sampling is the slowest but the most powerful at antialiasing.
Conclusion
There is nothing like creating something practical to cement your understanding of concepts. Now that I have finished project 1, I feel that I have a much deeper understanding of the graphics pipeline and of efficiency issues in C++ and graphics code in general.